SOFTWARES
RadExPro
- 2D/3D High resolution marine data processing
- Shallow seismic and VSP data processing
- 2D/3D marine and onshore data quality control, including real-time
- CPU and GPU parallel computations
- Flow replication, batches and queues for efficient processing of large volumes
- User-friendly Windows based software
RadExPro is flexible, state-of-art processing package, suitable for HR/UHR marine data processing, land shallow seismic data processing (refraction, reflection, MASW and VSP), as well as large-scale data QC, including Real-Time and fast-track processing.
Near-surface land data processing
Reflection:
RadExPro is fully capable for shallow structure imaging of both 2D and 3D land seismic reflection surveys with any type of source – sledgehammer, weight drop, guns, vibroseis and others.
Set of available algorithms includes refraction statics computation; crooked line CDP binning; linear and random noise attenuation algorithm’s, including 3D filters; SCAC; deconvolutions; auto statics routines; interactive velocity analysis; horizon-based velocity analysis; pre/post stack migrations.
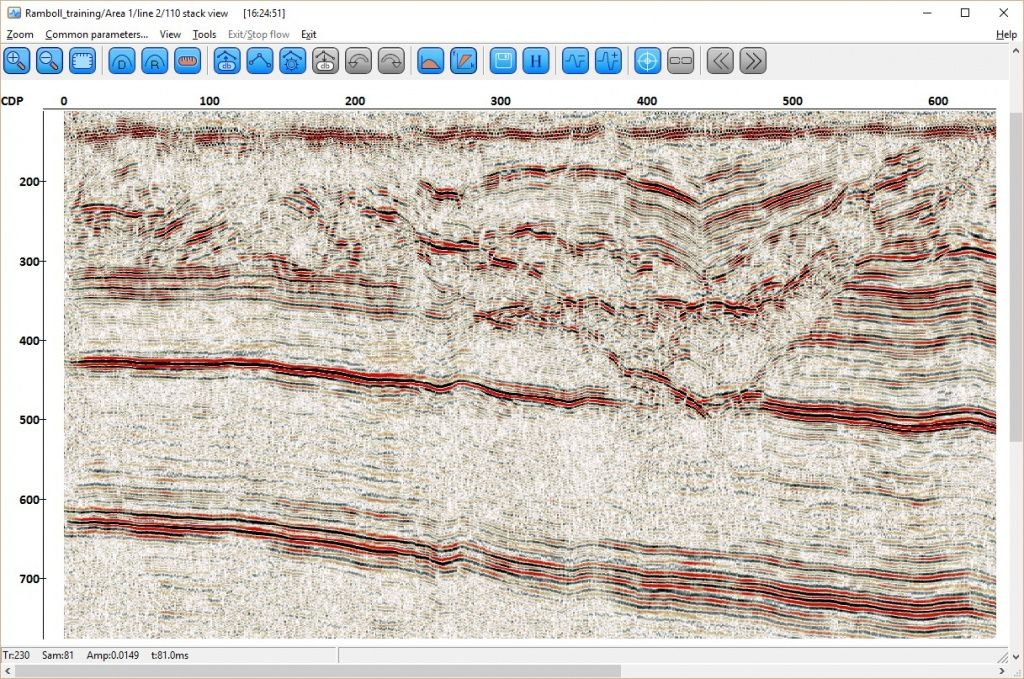
Processed CDP stack, acquired by reflection seismic method, data courtesy Ramboll
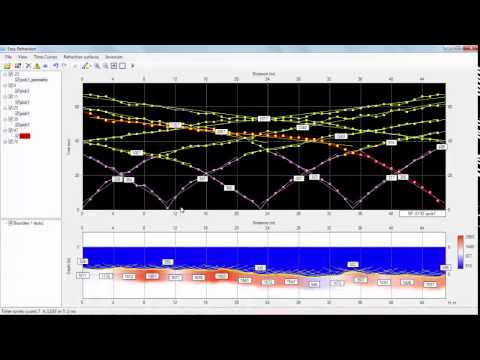
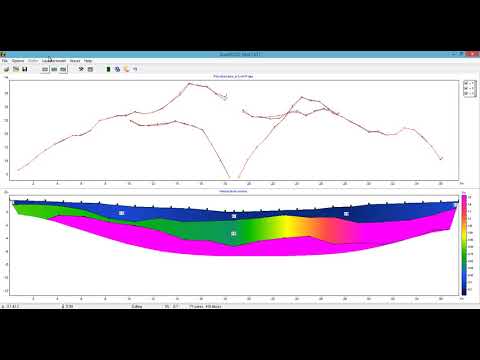
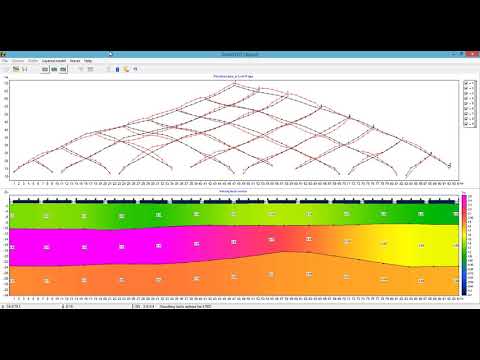
Refraction:
Seismic refraction surveys are widely used for shallow seismic engineering applications. Time-delay and GRM (General Reciprocal Method) methods are implemented in RadExPro.
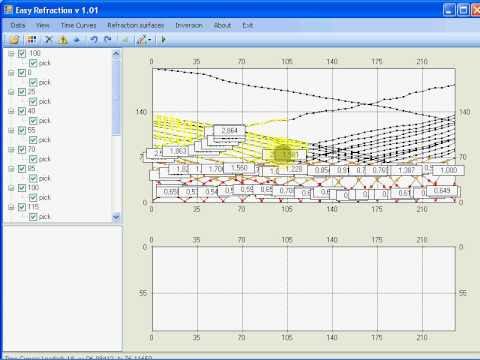
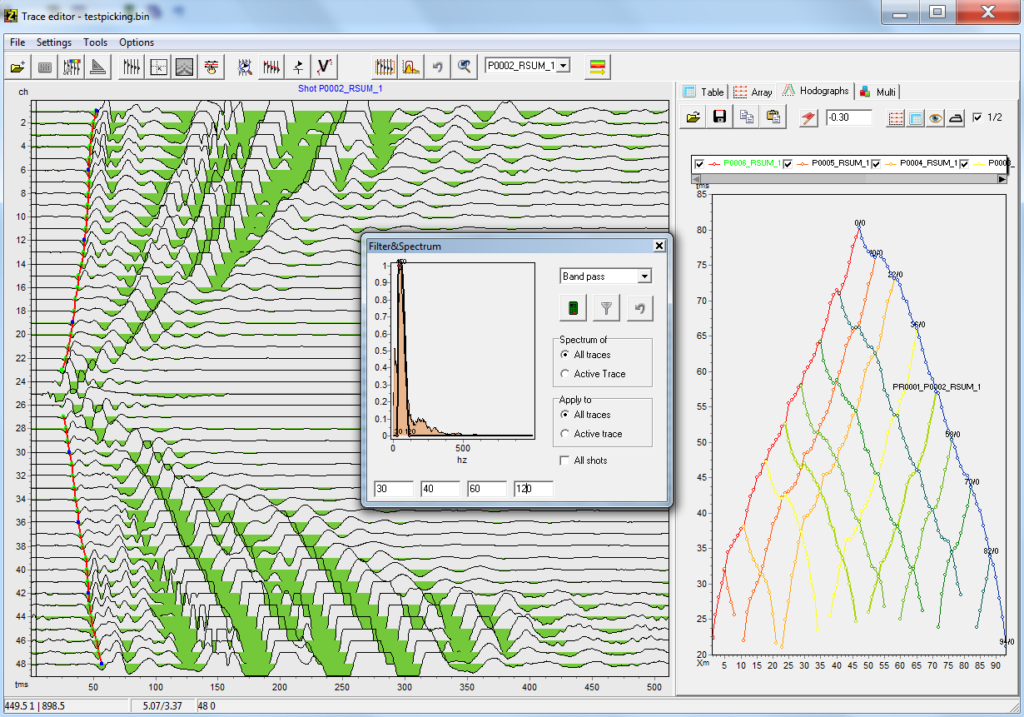
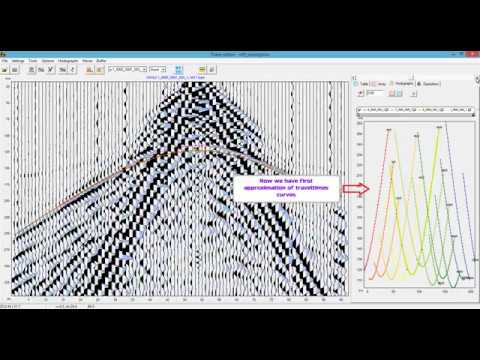
RadExPro provides fast and convenient automatic first break picking tool of seismic gathers to be used for further refraction analysis. All results are stored in the database and can be quickly accessed. Refraction horizons building process is fully interactive, which allows one to control the entire process from the very beginning up to the final image. This results in avoiding pitfalls during the processing and building the most relevant subsurface structure.
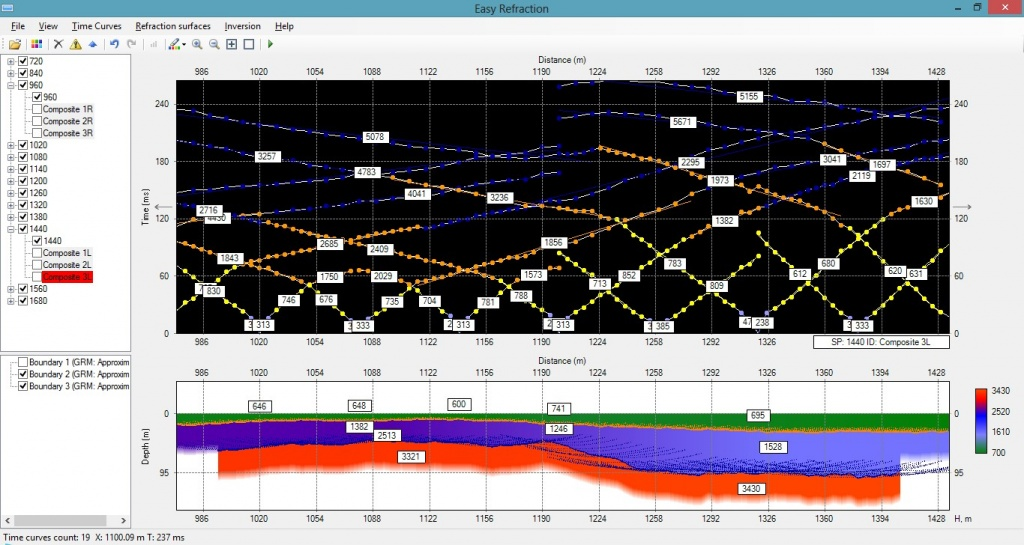
Refraction data processing using GRM: left – list of travel time curves and horizons, right top – branch assignment, right bottom – resulting geology section
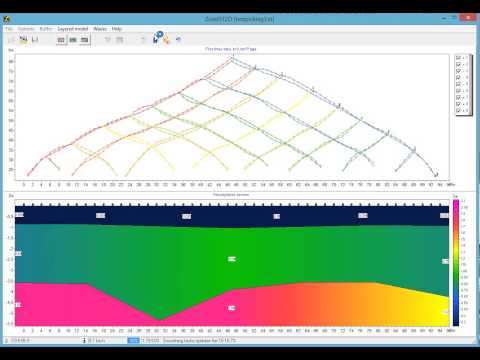
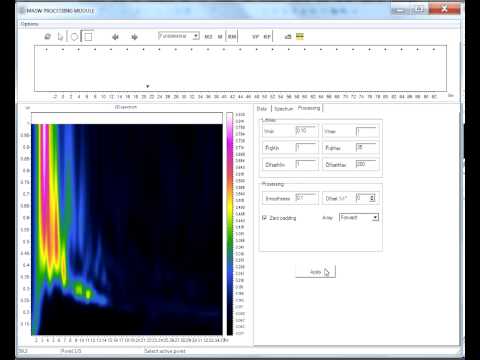
MASW:
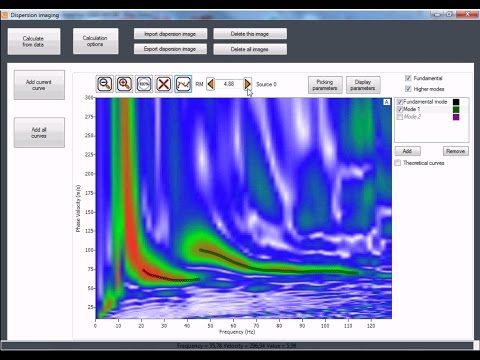
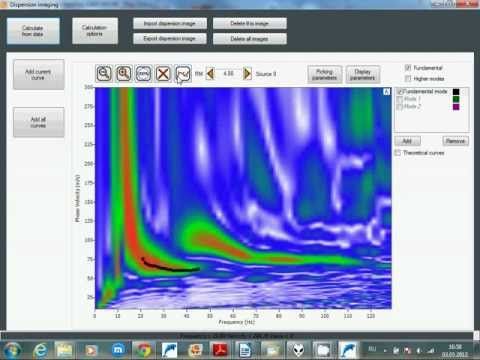
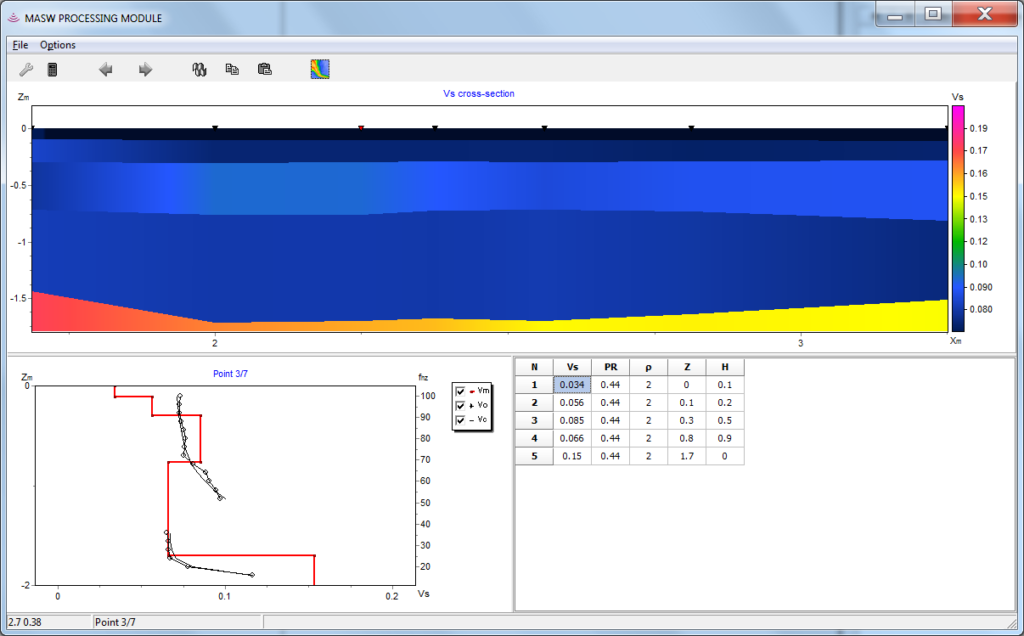
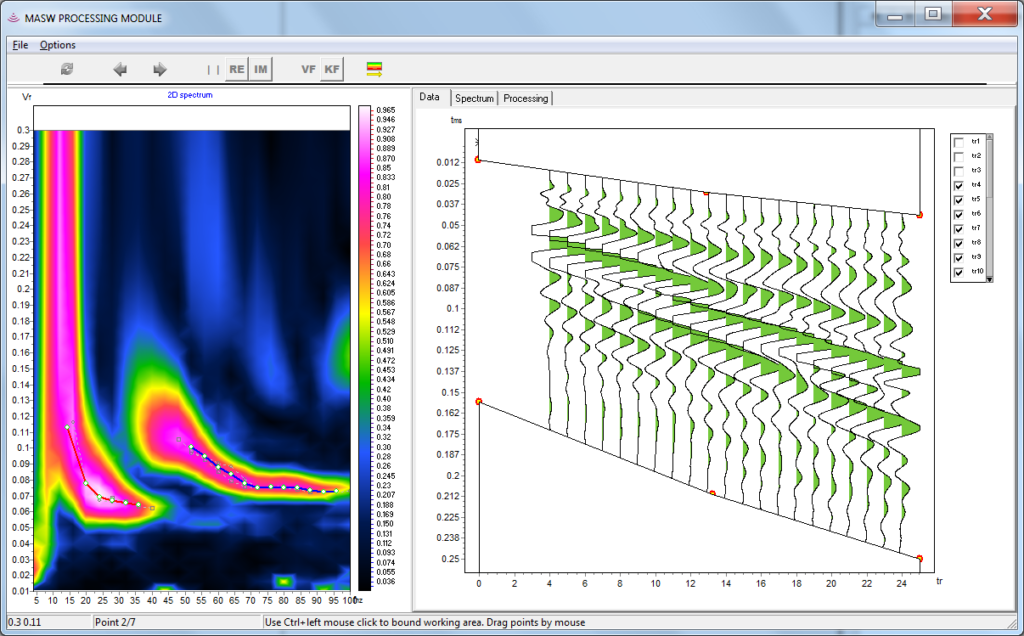
Multichannel analysis of surface waves utilizes Rayleigh wave dispersion properties to build Vs (shear wave) velocity profile up to 30 m depth for various geotechnical purposes. Ground roll strength on typical sledgehammer seismic record allows one to use its energy for MASW. General procedure for MASW processing includes dispersion curve calculation, fundamental and higher modes picking, followed by inversion. RadExPro has a dedicated MASW routine with user-friendly interface, which allows to perform all steps in a row up to final Vs section.

MASW dispersion image.
Fundamental and higher modes picking
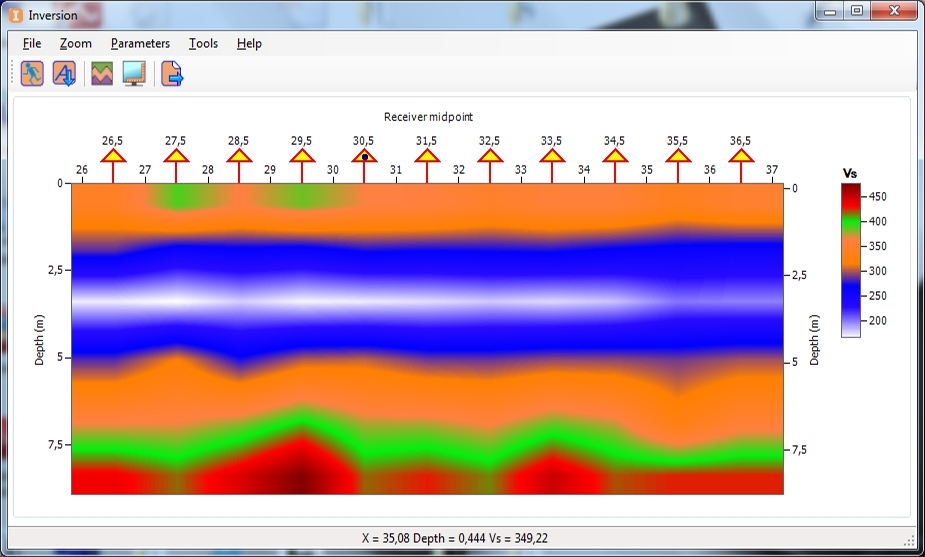
Resulting Vs section,
estimated by MASW dispersion curves inversion.
VSP, CST
Engineering VSP surveys
VSP and crosshole data processing requires efficient and sophisticated processing flow. RadExPro seismic software provides all necessary algorithms for multi-component data processing – hodogram analysis, 2C/3C component orientation, wavefield separation, velocity modelling, corridor stacking and well tie to reflection seismic data.
High-resolution marine seismic processing
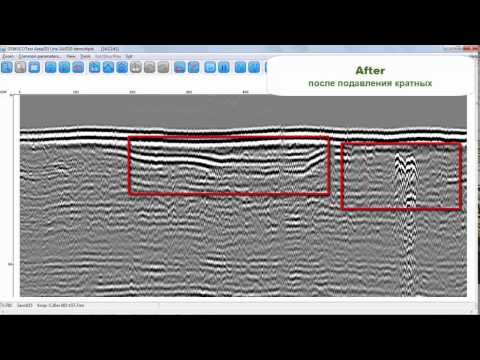
RadExPro has a complete set of algorithms for shallow marine seismic data processing, including modern denoising algorithms, static corrections, de-signature techniques (debubbling, adaptive deghosting, signal shaping), multiple removal (SRME), adaptive subtraction, 3D regularization, pre-stack migrations (PSTKM). Many routines are specially developed and adapted to high resolution data processing.
Large-scale seismic surveys
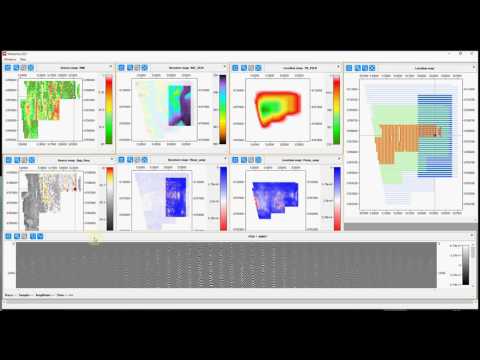
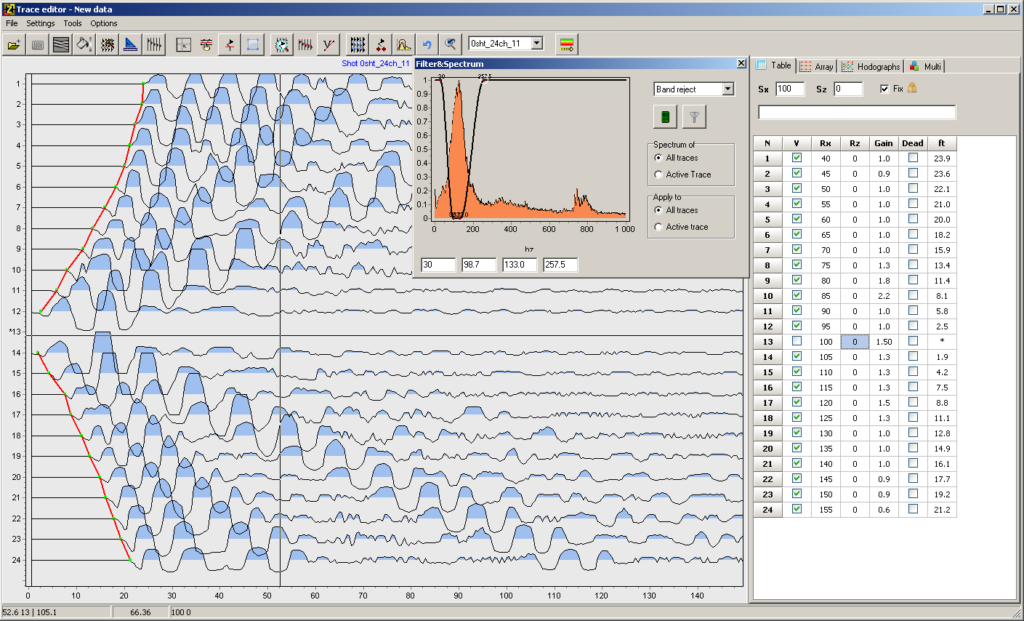
Data QC
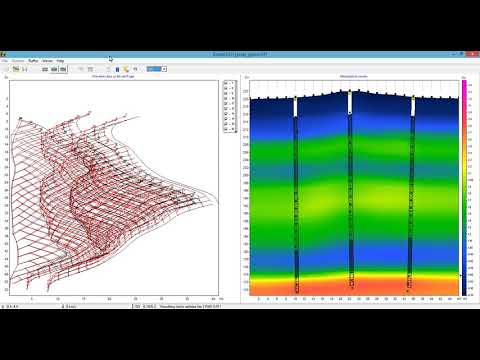
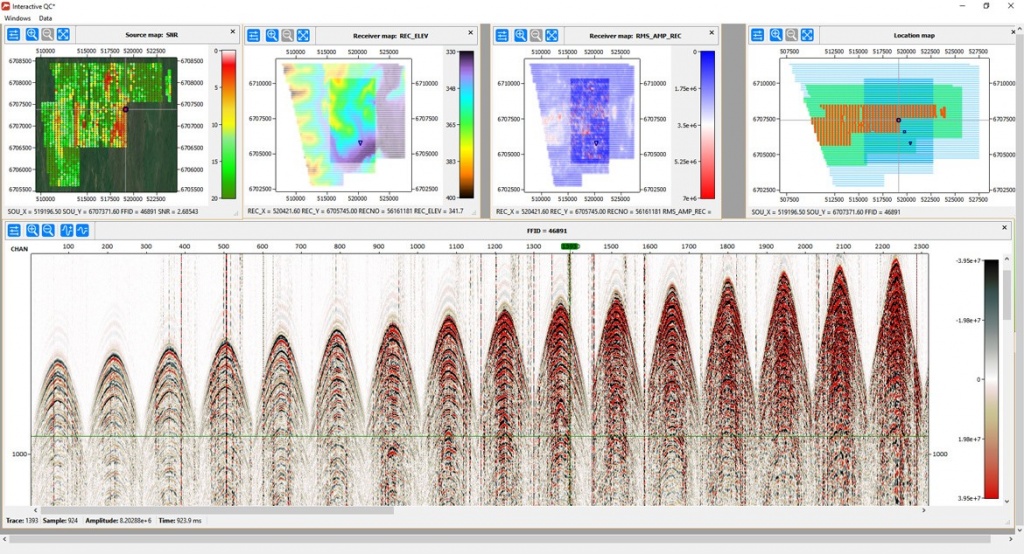
Infield data quality control is a standard procedure during oil and gas acquisitions, which typically includes position data quality checks, seismic data quality control and their relationship. RadExPro has various instruments, including data and spectrum analysis in user-defined windows, attribute analysis as well as modern interactive displays to provide the full control during the survey.

Interactive data quality control routine: top – seismic attribute maps, bottom – shot gather
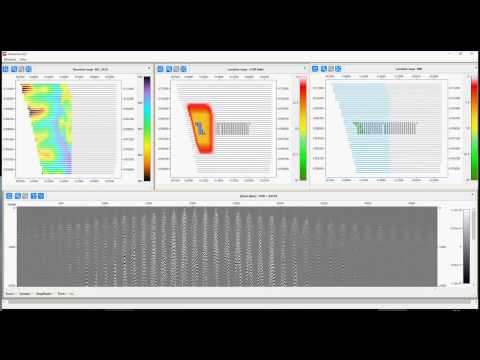
Real-Time data QC
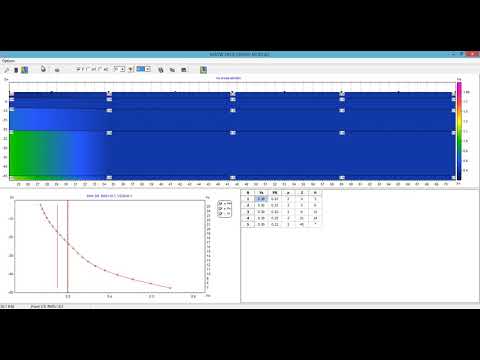
Real-Time Data Quality Control ensures that all acquired data are in the client’s specification. RadExPro has a unique system of reading data files, as soon, as they come to the server and feeding them into the QC flows, resulting in immediate display on each QC plot, without any delay. The set of QC is fully adjustable and can be constructed, based to the specifics of the particular survey and client’s requests. End of line reports with the QC maps are also available. Typical set of quality control products includes:
Source quality control – near-filed hydrophones check, bubble peak amplitude, primary-to-bubble ratio.
Data quality control – shot gathers, near-trace gathers, amplitude analysis, spectral analysis, channel maps, brute stack, etc.
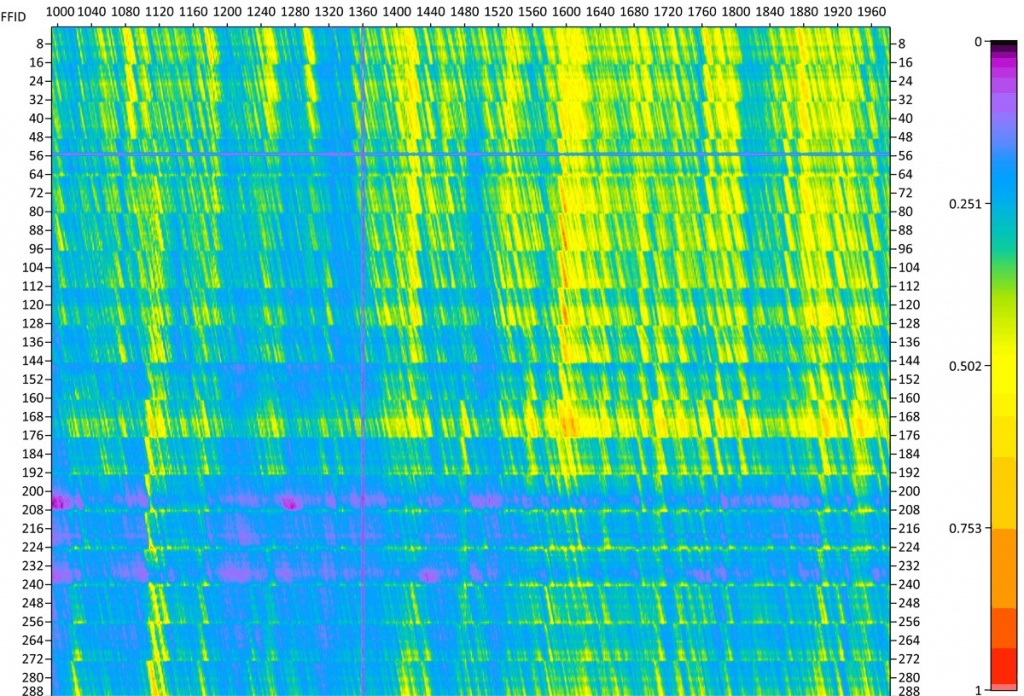
Real-time marine seismic QC – RMS attribute map. Vertical axis – channel number, horizontal axis -shot number. Purple lines indicates in both directions represent bad channel and shot correspondingly
Fast-track processing
Fast-track and in-field processing are typically performed as a part of data quality control routine and for quick evaluation of the seismic image. Often this type of processing runs parallel to the acquisition, i.e. on the seismic vessels. Replication and parallelization allow processors to compute high performance tasks after completion of each block or sail line and provide results to the client promptly.
| Start | Professional / Real-Time | |
| I / O | ||
| Input data from SEG-Y, SEG-2, SEG-B, SEG-1, SCS-3 files, with optional header | + | + |
| Input data from SEG-D and FairFieldNodal Receiver Gather files, with with optional header | + | |
| Input GPR data from LOGIS, Zond, RAMAC/GPR, GSSI, Pulse EKKO formats | + | |
| Input of data from a file in an arbitrary demultiplexed format, including information in the trace headers | + | + |
| Reading data from tape drives | + | + |
| Output of data to SEG-Y files with the ability to redefine the headers | + | + |
| Outputting data to an ASCII text file | + | + |
| Assigning geometry | ||
| Import from ASCII table files | + | + |
| Download from SPS and UKOOA files P1-90 | + | |
| Calculation using mathematical formulas | + | + |
| Display and editing in a spreadsheet view | + | + |
| Special interactive module for entering geometry into shallow data | + | + |
| Special module for entering marine geometry | + | + |
| Special input module for geometry VSP | + | |
| 2D and 3D bination along an arbitrary curvilinear profile | + | |
| Statics | ||
| Calculation of static corrections for relief | + | + |
| Calculation of residual static corrections for surface conditions | + | |
| Calculation of static corrections by the Maximum Power method | + | |
| Calculation of correlation static corrections | + | + |
| Applying static corrections | + | + |
| Working with amplitudes | ||
| Amplitude correction: linear (for spherical divergence), exponential, AGC, path balancing, time-varying amplification | + | + |
| AGC removal | + | + |
| Alignment of amplitudes between ensembles | + | + |
| Elimination of the constant component | + | + |
| Deconvolution and editing the shape of the spectra | ||
| Deterministic | + | + |
| Null-phase | + | + |
| Predicting | + | + |
| Whitening | + | + |
| Surface-matched | + | |
| Nonstationary predictive | + | |
| F-X predictive filtration (F-X deconvolution) | + | |
| Isolation of the zero-phase pulse | + | |
| Spectral factorization of Kolmogorov | + | |
| Spectral whitening | + | + |
| Changing the spectrum shape | + | |
| Exponentiation of the F-K / F-X amplitude spectrum | + | |
| Multicomponent processing | ||
| Analysis of hodograms | + | |
| Rotation of 2 or 3 components | + | |
| Rotating multi-component data FairFieldNodal | + | |
| Interpolation | ||
| Interpolation of traces along the profile to a regular step | + | + |
| Interpolation of the profile system to a regular grid (pseudo-cube calculation) | + | |
| 3D F-Kx-Ky regularization | + | |
| Working with headers | ||
| Math operations over header fields | + | + |
| Spreadsheet Editor | + | + |
| Import from ASCII files, export to ASCII files | + | + |
| Averaging in a sliding window | + | + |
| Shifting header field values to a specified number of traces | + | + |
| Input and output of kinematic corrections to the value in the header | + | + |
| Surface-consistent linkage of the heading header value (eg static shifts or amplitudes) | + | |
| Displaying header field values as graphs | + | + |
| Analysis of values on related cross-spacing and histograms | + | |
| Combining Data Sets | ||
| Subtraction / addition of two sets of data | + | + |
| Vertical integration of two data sets along the horizon | + | |
| Filtering and operations on the routes | ||
| Frequency Filtering: | ||
| strip filtering with a simple trapezoidal filter | + | + |
| Ormsby filter | + | + |
| Butterworth filter | + | + |
| band-stop filter | + | + |
| Two-dimensional filtering | + | + |
| F-K filtration | + | + |
| F-X predictive filtration (F-X deconvolution) | + | |
| 3D F-X-Y deconvolution | + | |
| Radon Transformation | + | |
| Calculation of the amplitude spectrum | + | + |
| Calculation of the phase spectrum | + | + |
| Calculation of autocorrelation and cross-correlation functions | + | + |
| Logarithm and Exponentiation | + | + |
| Adaptive subtraction of wave fields | + | |
| Convolution | + | + |
| Arithmetic operations trace / trace and trace / scalar | + | + |
| Raising the route to the power | + | |
| Conversion to radial routes (direct and reverse) | + | + |
| Suppression of local high-amplitude interference (“emissions”) | + | + |
| Frequency-domain noise reduction (TFD noise attenuation) | + | |
| Noise reduction in the frequency-time domain (manual) | + | |
| Edit traces | ||
| Resampling traces | + | + |
| Elimination of unwanted traces | + | + |
| Zeroing of trace sections (muting) | + | + |
| Polarity reversal | + | + |
| Changing the length of the route | + | + |
| Time-to-depth conversion | ||
| Translation of data from the time scale to the in-depth and vice versa using different speed laws | + | + |
| Migration and DMO | ||
| 2D/3D Kirchhoff time migration before and after summation | + | |
| F-K migration Stolta | + | + |
| Three-dimensional F-K migration Stolta | + | |
| T-K migration | + | + |
| 2D F-K DMO | + | |
| QC and attribute analysis | ||
| Quality control of seismograms OPV / OPP: calculation of mean and rms amplitude, signal-to-noise ratio, resolution, and visible frequency in rectangular or shaped space-time window | + | |
| Quality control of seismograms OPV / OPP: calculation of mean and rms amplitude, signal-to-noise ratio, resolution, and visible frequency in rectangular or shaped space-time window | + | |
| Calculation of the multiplicity and distribution of deletions | + | |
| Observation system maps, multiplicities, distribution of deletions | + | |
| Analysis of the relationship between header fields using crossplots and histograms | + | |
| Mapping of attributes with a cartographic substrate | + | |
| The estimation of the average amplitude in the window, the rms amplitudes in the window, the maximum value of the amplitude, the minimum value of the amplitude, the maximum absolute value of the amplitude | + | |
| Determination of the time corresponding to the maximum, minimum, maximum absolute amplitude value | + | |
| Determination of the dominant and apparent frequency, centroid frequency, width spectrum on the total section in the window along the horizon | + | |
| Determination of the signal-to-noise ratio on the total section in the window along horizon | + | |
| Calculation of ACF and FVK | + | |
| Interactive determination of the velocities of all types of waves | + | + |
| Calculation of instantaneous frequency, amplitude and phase | + | |
| Interactive maps of attributes | + | |
| Velocities and summation of CDP | ||
| Binning of 3D data on common midpoints | + | |
| 2D binning along CDP along an arbitrary curvilinear profile | + | |
| Formation of OGT seismograms | + | + |
| Formation of superseismograms | + | + |
| Recalculations of speed laws | + | |
| Interactive analysis of CDG summation rates | + | + |
| Pororizontal velocity analysis | + | |
| Calculation and input of kinematic corrections | + | + |
| Summation of CDP | + | + |
| Processing of marine data | ||
| Entering Geometry in Marine Data | + | + |
| Importing geometry from UKOOA files P1-90 | + | |
| Correction of casual and missed shots | + | + |
| Importing static corrections for tides | + | |
| Calculation of static corrections for marine seismoacoustics | + | |
| Suppression of repeated pulsation of the bladder | + | |
| Suppression of multiple waves using 2D SRME technology | + | |
| Suppression of multiple seismic acoustics with small deletions on data | + | |
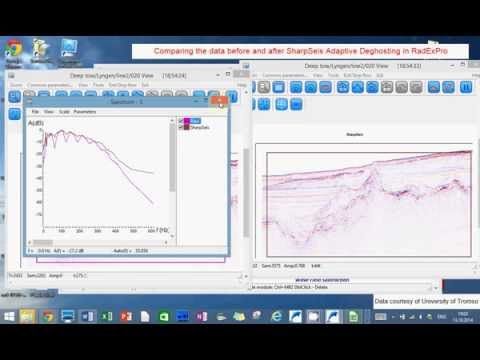
| SharpSeis™ adaptive satellite-wave suppression / broadband processing | + | |
| MPW | ||
| The processing of travel curves of refracted waves by the method of MPW (t0 and GRM) | + | + |
| Processing of the first arrivals of refracted waves | + | + |
| Surface wave analysis | ||
| The construction of the model of transverse wave velocities of the upper part of the section by means of a multichannel surface wave analysis (MASW) | + | + |
| Vibroseis | ||
| Correlation | + | + |
| VSP | ||
| Entering geometry and inclinometry in VSP data | + | |
| Analysis of hodograms, 2C and 3C rotation | + | |
| Separation of wave fields | + | |
| Calculation of the arrival time of a direct or reflected wave from a given horizon for a horizontal-layered model | + | |
| Construction of a layered velocity model | + | |
| Calculation of the arrival time of a direct or reflected wave from a given reflecting boundary for a horizontal layered medium | + | |
| Kinematic corrections of non-longitudinal VSP | + | |
| Import logging data, import and export speed models | + | |
| Loading and unloading speed models, logging data | + | |
| Joint interpretation of VSP, GIS, seismic data | + | |
| Kirchhoff migration of VSP seismograms | + | |
| VSP-OGT transformation | + | |
| Visualization and printing | ||
| Data visualization by various methods | + | + |
| The display of traces by the method of deviations over the velocity or data field, derived by the variable density method | + | + |
| View and compare multiple profiles at once | + | + |
| Synchronization of scales, scroll bars and amplification between several windows for convenient data comparison | + | + |
| Interactive calculation of the amplitude spectrum of any data fragment | + | + |
| Displaying multiple spectra in one window | + | + |
| Visualizing header field values | + | + |
| Display profiles, attributes, horizons, etc. on the map | + | + |
| Visualization of a seismic section along an arbitrary line from a map | + | + |
| Adding linear objects to cuts in three-dimensional space | + | + |
| Export of a cross-raft, histograms of header fields to a bitmap image | + | |
| Print processing results with preview | + | + |
| 3D visualization | ||
| 3D Cube Visualization | + | |
| Data and stream management | ||
| Processing in the framework of projects. Projects are easily migrated with all data and parameters | + | + |
| Ability to work with several projects simultaneously | + | + |
| Create queues for processing threads for parallel execution | + | + |
| Copying processing threads with all procedures and parameters | + | + |
| Export / import processing flows between projects | + | + |
| Processing history | + | + |
| Running a set of processing routines with different parameters to compare results | + | + |
| Rearrange data during processing | + | + |
| Fast re-sorting of large amounts of data in the process | + | |
| Combining multiple threads into a queue, concurrent execution bursts | + | |
| Batch processing of the file list in one thread | + | |
| Interpolation / extrapolation of horizons | + | |
| Interpretation | ||
| Tracking reflections in manual and automatic modes | + | + |
| Building a grid on the impaled horizons or attributes | + | + |
| Calculation of attributes along horizons | + | |
| Simultaneous analysis and comparison of different types of data to the map and in three-dimensional space | + | |
Real-time interactive QC of land 3D seismic in the forthcoming RadExPro 2017.1 (31.03.2017)
Interactive QC of 3D land seismic in RadExPro (31.03.2017)
Seismic Refraction Data Analysis in RadExPro 2016 (Plus-Minus) (26.12.2016)
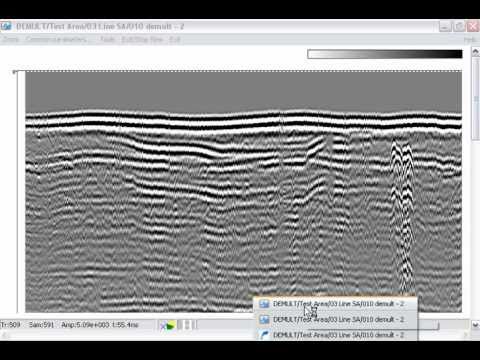
Demultiple of single-channel boomer data in RadExPro 2016 (26.12.2016)
MASW in RadExPro 2016 (28.11.2016)
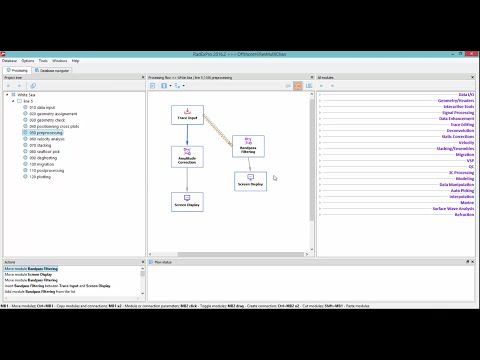
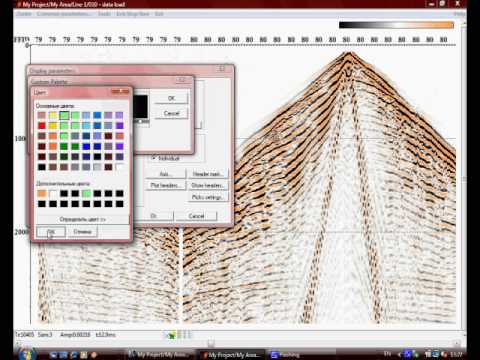
Welcome to the brand new RadExPro 2016.2 main window! (5.07.2016)
Seismic data before and after ShaprSeis processing (13.10.2014)
MASW (Multi-Channel Analysis of Surface Wave) in the RadExPro seismic software (3.05.2012)
Marine seismic processing: suppression of multiples on high-resolution single-channel marine seismic data without disturbing primary reflections using RadExPro software (12.05.2011)
Refraction seismic processing in RadExPro software: automatic inversion of first breaks. (15.02.2011)
Reflection seismic processing in the RadExPro software (16.02.2010)
ZondST2d — 2D seismic data processing and interpretation software
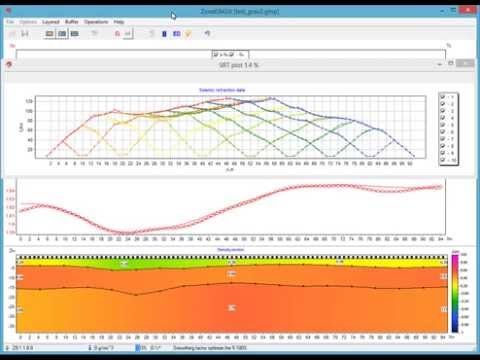
- Seismic tomography
- First arrival picking on seismic gathers
- MASW-ReMi — surface waves data processing and interpretation
- Refraction waves forward modeling and inversion in arbitrary layered medium
- Amplitude inversion
- Seismic tomography on the arrival times of reflected waves
- Module for Nakamura method
ZondST2D is designed for 2D interpretation of seismic tomography data on refracted and reflected waves (land, cross-borehole and water variants).
ZondST2d is a part of Zond Software family of programs with unified interface and data processing sequence. It’s easy to start working in ZondST2d if you have experience of processing in any other Zond product. Compatibility of data formats inside Zond Software package helps to combine geophysical data from different methods and sources in order to obtain much more stable and reliable geophysical models.Zond Software family:
| ZondST3d | Designed for 3D inversion of seismic tomography data (first breaks) and refraction seismic. |
| ZondIP1d | Designed for 1D inversion of VES and VES-IP data. |
| ZondRes2d | Designed for 2D interpretation of electrical resistivity and induced polarization tomography (ERT and IP) data |
| ZondRes3d | Designed for 3D inversion of resistivity and induced polarization data in land, borehole and marine variants. |
| ZondProtocol | Designed for creation of protocols, measurement control and visualization of ERT measurements and data quality assessment. |
| ZondMT1D | Designed for 1D inversion of magnetotelluric (MT), audiomagnetotelluric (AMT) and radiomagnetotelluric (RMT) data. |
| ZondMT2D | Designed for 2D inversion of MT, AMT and RMT data. |
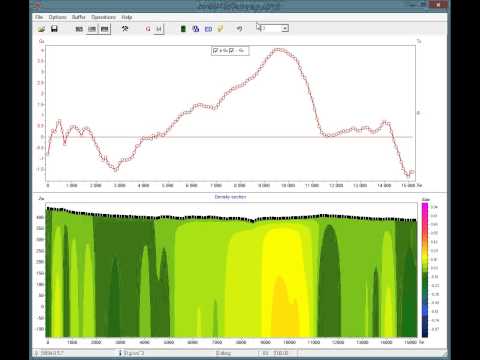
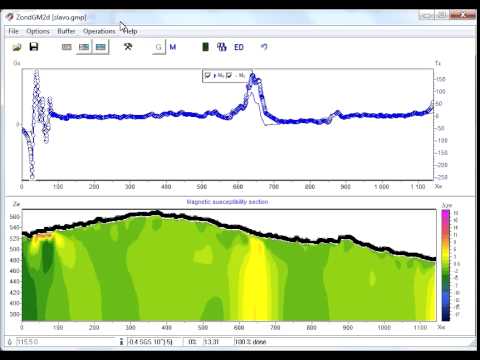
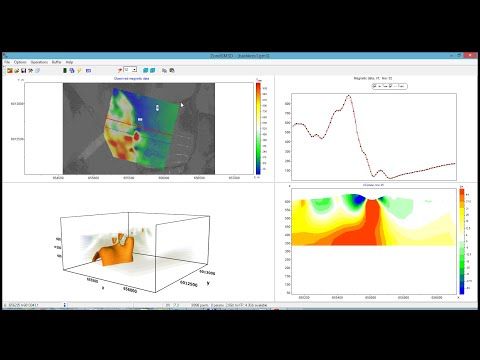
| ZondGM2d | Designed for 2D multiprofile inversion of gravity and magnetic data. |
| ZondGM3d | Designed for 3D inversion of gravity and magnetic data. |
| ZondTEM1d | Designed for 1D inversion of transient electromagnetic (TEM) data for various observation systems with lines and loops. |
| ZondTEM2d | Designed for 2D inversion of EM soundings data in time and frequency domain. |
| ZondSP2d | Desined for 2D inversion of self-potential data. |
| ZondST2d | Designed for 2D seismic tomography interpretation (refracted waves). Modules: MASW, Attenuation tomography, Layered media, Anisotrophy. Nakamura(HVSR) is included. |
| ZCGViewer | Designed for calculation and visualization of apparent resistivity graphs obtained with various electric survey systems. |
Software requires OS Wndows 98 or later version.
Following modules are included in ZondST2d:
- Seismic tomography
- First arrival picking on seismic gathers
- MASW-ReMi — surface waves data processing and interpretation
- Refraction waves forward modeling and inversion in arbitrary layered medium
- Amplitude inversion
- Seismic tomography on the arrival times of reflected waves
- Module for Nakamura method
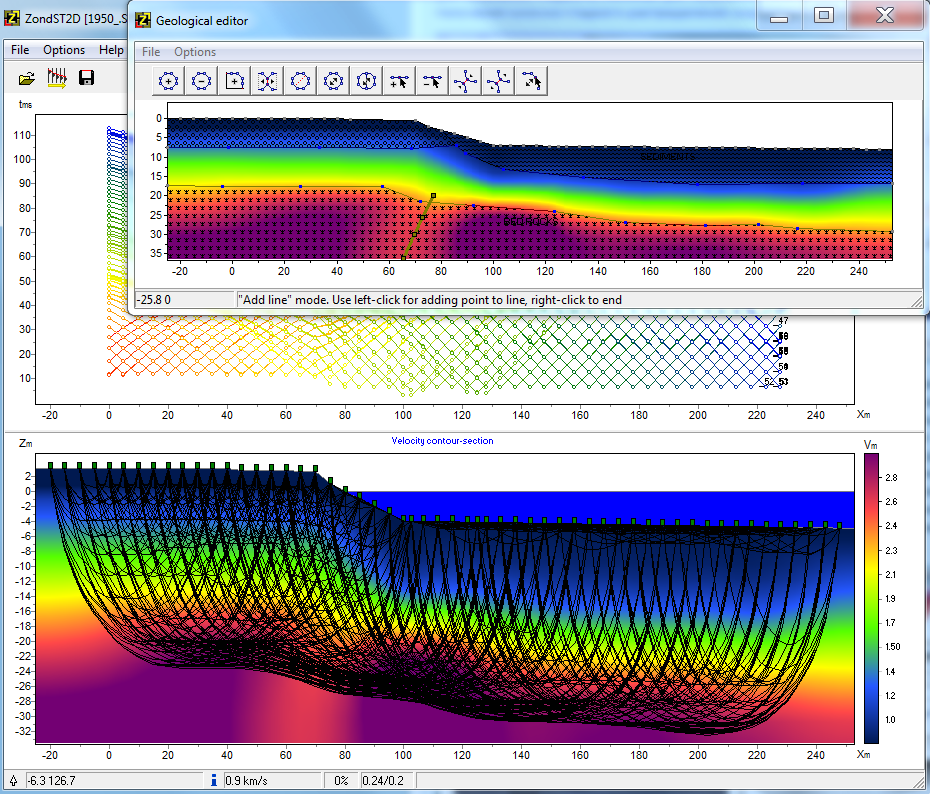
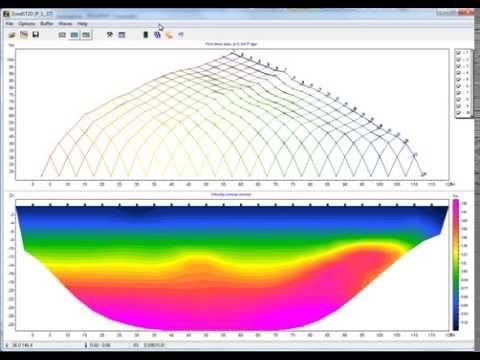
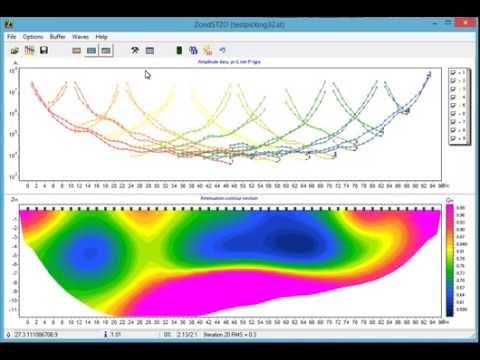
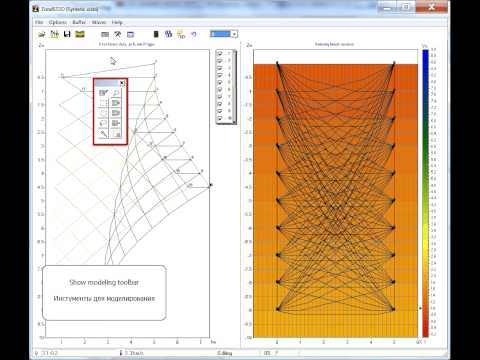
The seismic tomography module is a ready-to-use solution for seismic tomography that solves a wide range of problems from mathematical modeling and sensitivity analysis to inversion and field data interpretation.
Shortest path’s algorithm is used to solve the forward problem of ray tracing. Algorithm is characterized by high speed calculations and controlled accuracy. The method allows to calculate the shortest path of refracted wave. The combination of the shortest ray paths from the source and receiver to the reflector allows to generate a reflected wave path for each boundary. A section of the boundary with minimum total passing time from the source and receiver is selected as a reflection point.
Ray tracing algorithm is implemented in three ways: 1. Ray approximation. Constant velocity inside a cell. 2. Ray approximation. Velocity inside a cell changes linearly. Velocities are defined in nodes. 3. Modeling of a variable radius ray channel. Velocity inside a cell changes linearly. Velocities are specified in nodes.
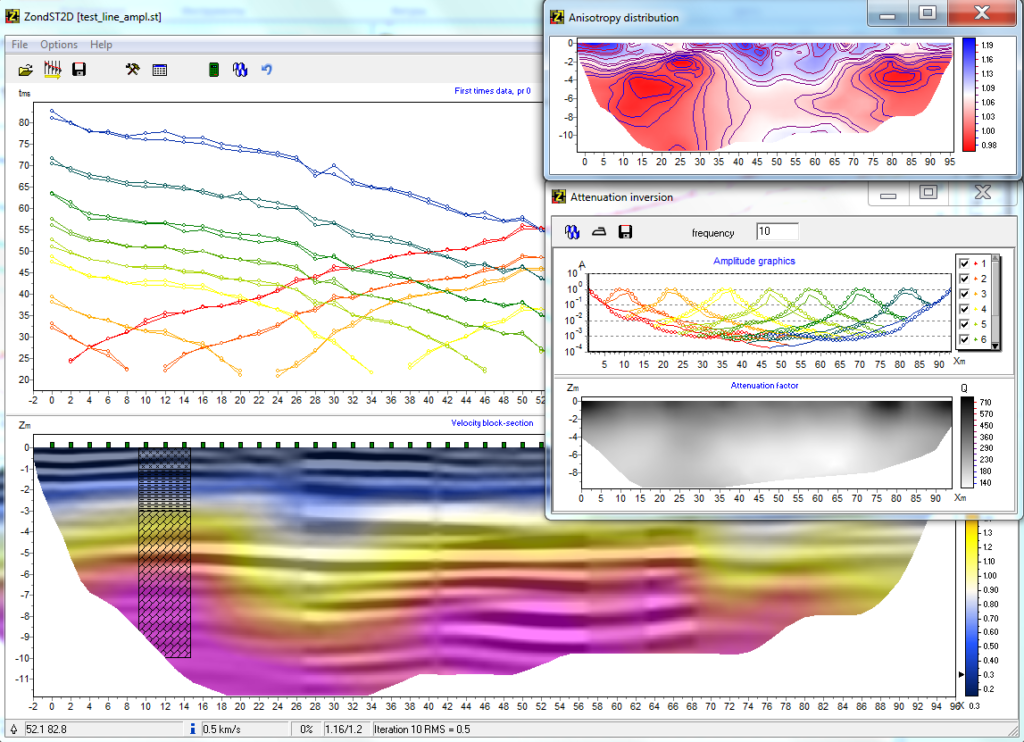
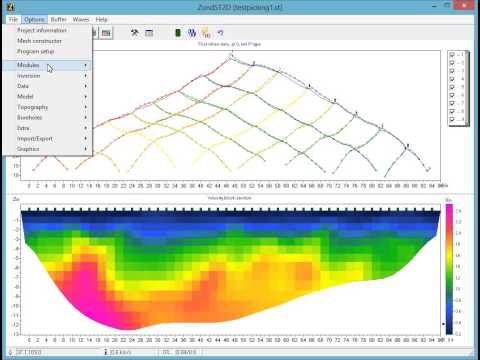
Seismic tomography module allows to obtain velocity cross-sections for both pressure and surface waves. Sources and receivers can be placed on the ground, water surface, seabed or in boreholes. It is also possible to use the module for interpretation of vertical seismic profiling (VSP) data. Additionally to velocity cross-sections estimation, reconstruction of velocity anisotropy distribution has been implemented. The program uses the simple version of the seismic velocity anisotropy ratio — Vx/Vz.
First arrival picking on seismic gathers module interface is designed to simplify and automate the process of picking of first arrivals. Module provides a variety of visualization methods and immediate access to the most common functions. The user can simultaneously pick several types of Vs, Vp refracted waves and up to 3 reflected waves. Data processing is optimized for joint use of P- and refracted S-waves.
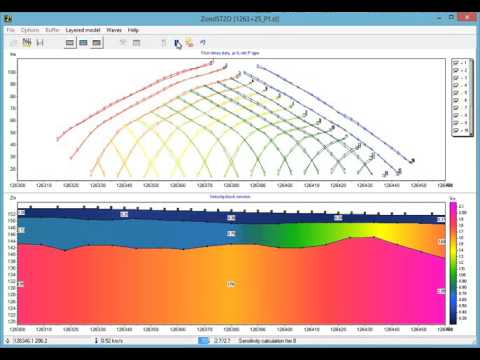
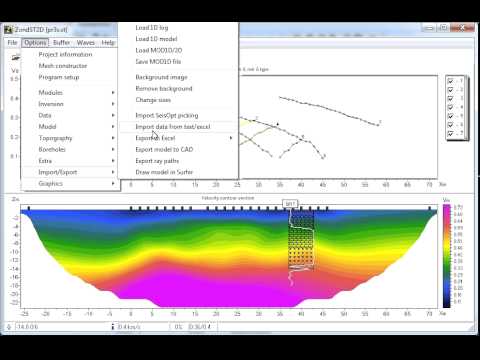
Refraction waves forward modeling module is designed to obtain arbitrarily layered sections according to the refracted (or reflected) waves method. The velocity section is defined by a set of layers with free layers geometry and arbitrary velocity distribution along the profile in each layer. Complexity of horizon geometry is controlled by the number of nodes. Any layer may be reflective and refractive, or refractive only. The application implements a precise solution for an arbitrary layered medium. The ray is passing according to Fermat principle, which correctly describes the physics of the process, unlike the t0 method, where the wave always slides on the refraction edge. The module allows modelling arrival times of the refracted and reflected waves and to solve the inverse problem of observed times both combined and separately. Joint inversion of VES, MT, AMT, RMT, TEM data, gravity and magnetic surveys is available in the module.
The surface wave dispersion analysis,implemented in the MASW module enables to obtain Vs velocity profiles from field data. The program provides a full cycle of data processing from dispersion curves estimation up to velocity section building. Multi-modal inversion is also available.
The Amplitude Inversion module implements the Attenuation tomography algorithm and allows to obtain a section of the Q attenuation parameter from the values of the first break amplitudes. The problem solution is based on a preliminarily obtained velocity section. The first break amplitudes’ values are picked simultaneously with times.
Additional GraviMagnetic module provides efficient combining of gravity and magnetic surveys with velocity section with single frame. Frame based on seismotomographical section is filled with gravity and magnetic data automatically or manually.
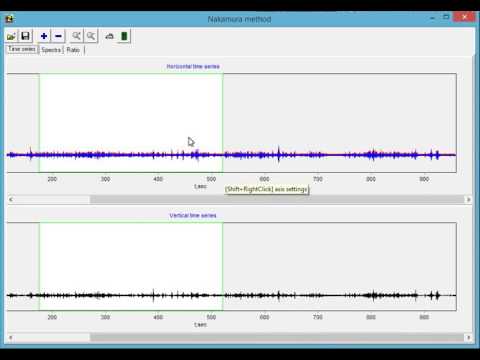
Special Nakamura application provides spectra estimation, microseisms analysis, performs generation H/V ratio spectra and modeling of 1D Vs vertical sections.
Detailed information about ZondST2d functions can be easily found in User Manual and in video tutorials. Also, you can get demo version by link given below.
Configurations:
Three versions of ZondST2d are available:
ZondST2d Full version — all functions and modules are included.
ZondST2d Refraction version — configuration with all functions needed for ground seismic tomography data processing.
ZondST2d MASW version — includes all functions for surface waves processing and Nakamura method.
ZondST2d versions and their functions:
| Modules and functions | Full version | Refraction version | MASW version |
| Seismic tomography module for land data processing | + | + | – |
| Seismic tomography module for land, borehole, cross-borehole and marine data processing | + | + | – |
| Anisotropy calculation | + | + | – |
| First arrival picking module | + | + | + |
| MASW module — surface wave data processing and interpretation | + | – | + |
| Refraction waves forward modeling module — an arbitrary layered medium | + | + | – |
| Amplitude inversion | + | + | – |
| Seismic tomography on the arrival times of the reflected waves | + | + | – |
| Nakamura method | + | – | + |
| Joint inversion with electromagnetic (VES, MT, AMT, RMT, TEM), gravimetric and magnetic data | + | + | – |
Joint inversion of Rayleigh and Love dispersion curves in ZondST2D (24.10.2021)
What you can have with ZondST2D spent 20 min only (3 shots survey) (23.06.2020)
Picking and inverting of reflected data in ZondST2D (04.06.2020)
ZondMT2D’s MT-editor for MT sounding data postprocessing (20.05.2020)

Joint inversion of MASW and seismic refraction data (21.06.2019)
High resolution cross-hole 2D seismic tomography (24.03.2019)
HVSR data inversion (08.11.2017)
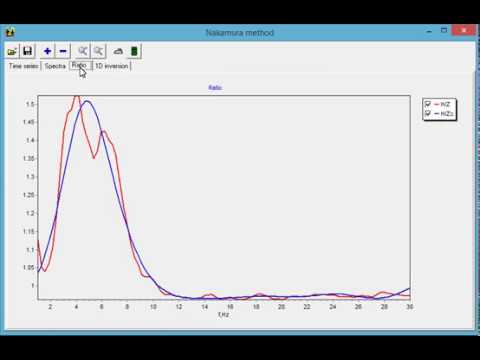
Application for Nakamura method (14.12.2016)
Cross gradient joint inversion of seismic refraction data Vp and Vs in ZondST2D (17.07.2016)
Amplitudes inversion in ZondST2D (29.06.2016)
Joint inversion of MASW and refraction seismic data (29.04.2016)
ZondST2D seismic software. Overview 2016 (6.04.2016)
Inversion of first break amplitudes in ZondST2D (6.11.2014)
ZondST2D overview of features. Part II. (11.10.2014)
New features of ZondST2d picker (10.10.2014)

Forward modeling in ZondST2d (22.06.2014)
Joint interpretation ERT and refraction seismic data (29.05.2014)
New features of Zond 2d softwares (25.05.2014)
New features of ZondST2D for MASW and ReMi (28.10.2013)
ZondST3d — 3D seismotomography interpretation (refracted waves)
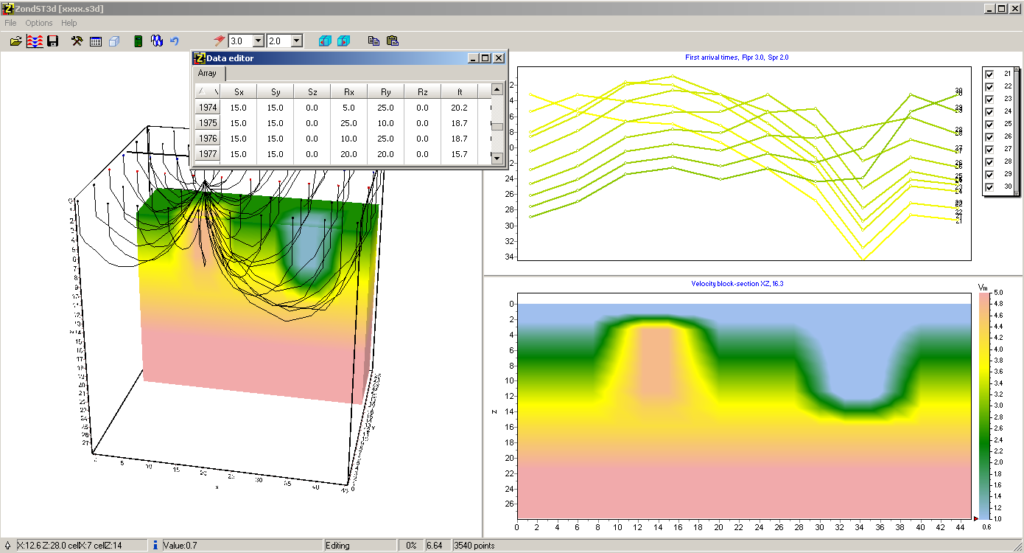
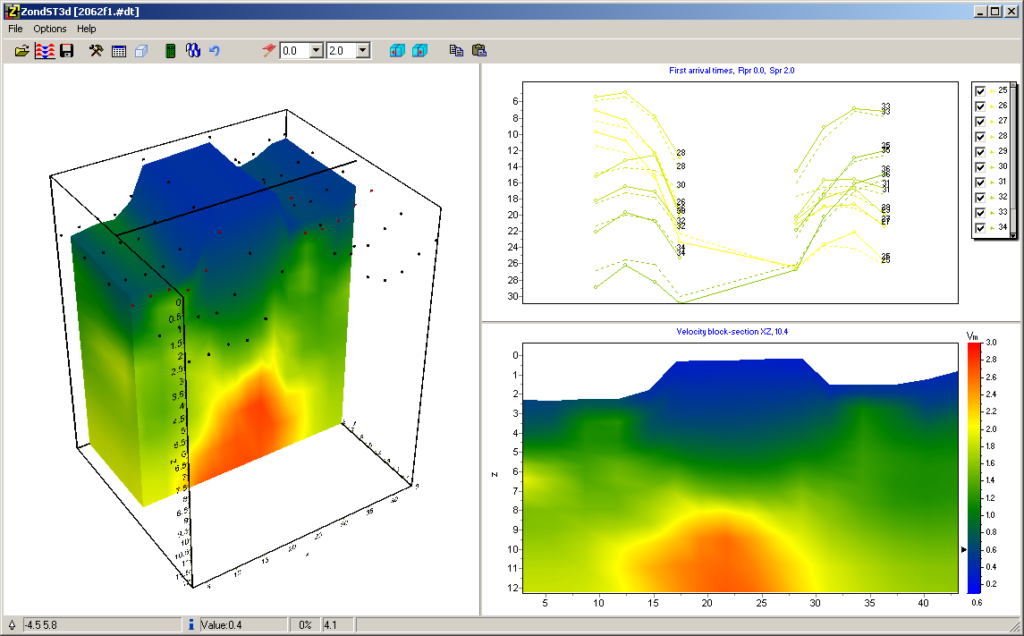
ZondST3d is designed for three-dimensional interpretation of seismic tomography data on refracted waves (land, cross-borehole and water variants).
In geophysics, the term seismic tomography is known for a long time. This is due to the fact that one of the main problems in seismology — the inverse kinematics. It consists of determination the velocity structure at a known time path of the refracted waves from source to receiver. Cross-borehole seismotomography is one of the most popular methods in engineering geophysics; it is used for detailed determination of structures’ velocities in interwell space.
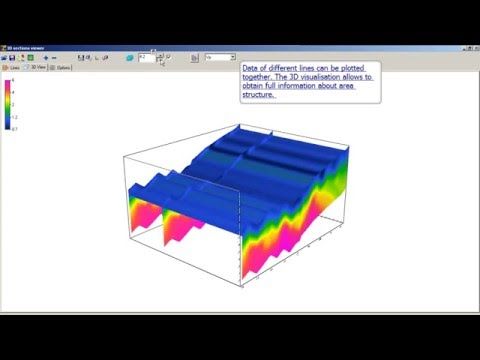
The technique of three-dimensional seismotomography means special survey with using of great number of sources and receivers positions. Sometimes number of trace is reach thousand and tens thousand. But in many cases for three-dimensional interpretation it is enough to use the results of a two-dimensional seismotomography observed on several parallel lines.
ZondST3d represents ready solution for seismic tomography, and solves wide range of problems from mathematical modeling and quality control to field data processing and interpretation. Convenient interface and variety of data visualization features allow to solve wide range of geological problems with maximum effectiveness.
The software consists of two basic modules. One for the first times picking on the seismograms. The second is used for solving forward and inverse problems of seismic tomography.
For the seismograms processing developed a special interface designed to simplify and automate the process of first arrivals picking. Special attention is paid to variety ways of data visualization and simple access to frequently used functions.
Solution of forward problem basis on special ray tracing algorithm of graph theory (Shortest path’s method). This algorithm is characterized by a high-speed calculations, and controlled accuracy.
ZondST3d uses simple and clear data format which allows easily combining various systems of observation, including different variants of the topography setting up and other additional information.
Some variants of three-dimensional model display in the form of various sections and isosurfaces are realized in the program.
Important stage which prevents field measurement is mathematical modeling of velocity structure of work site. Modeling gives a chance to estimate the level of reflected waves first times and to make a choice of optimum parameters of the observation system for decision of formulated geological problem. ZondSt3d has great range of tools for mathematical modeling and analysis of first times field.
As the general task of the program is inversion of velocity parameters, some variants of inverse problem decision are realized in ZondST3d, basic of them are: smoothing inversion — to get smooth model and focusing — to get piece-smoothed model of velocities with depth. While program was designed special consideration given to a priori data accounting. Because of equivalence of inverse geophysical problems, quality of the obtained results strongly depends on the amount of a priori data used. In ZondST3d there is possibility of weights setting for measurements, fixing and limits making of changing features of different cells, using of a priori model as reference in inversion. The robust schemas of noise estimation are realized in the software. There is also possibility to import and display results of measurements by other methods and cross-boreholes data that improved quality of results.
More details on the functionality of the software can be found by downloading the user manual as well as its demo-version or by watching video reviews and tutorials.
ZondST3d overview (5.11.2016)
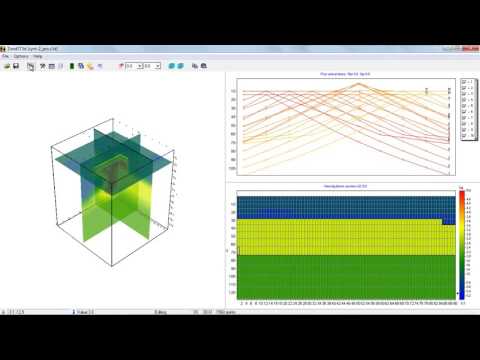
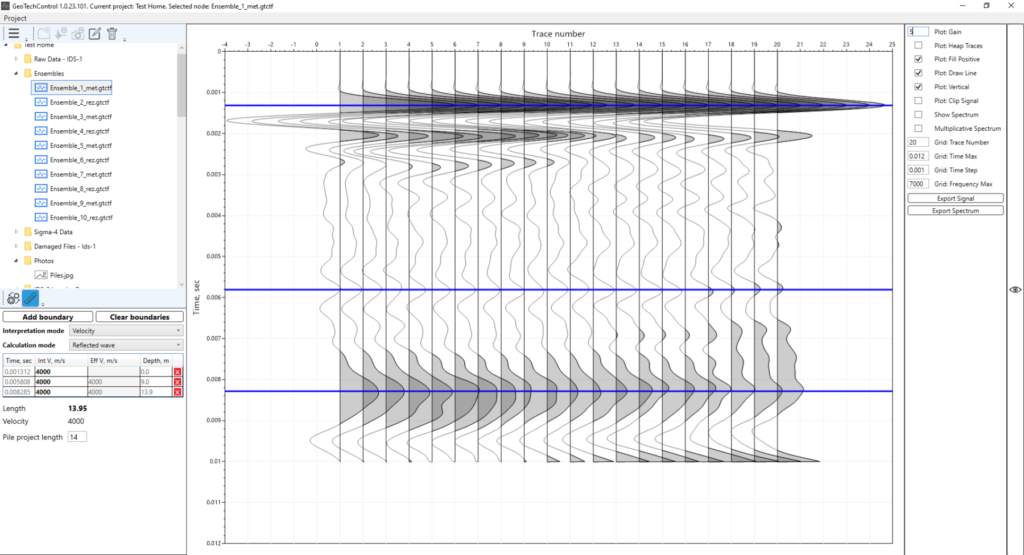
GeoTechControl
- Control of length, continuity and quality of piles
- Search for voids behind tunnel lining
- Assessment of the state of contact of the foundation slab with the ground
- Attribute analysis of seismic records
The GeoTechControl software is designed for processing and interpreting data obtained by the seismoacoustic method of surveying building structures
GeoTechControl allows:
- To process the data obtained by Sonic Integrity Testing for solving geotechnical problems
- determinations of piles’ length
- determination of piles’ integrity
- Conduct dynamic attribute analysis of seismic gathers:
- for searching for weakened piles with reduced concrete strength
- for evaluation of pile-soil contact conditions
- for assessment of the condition of the foundation slab with ground
- for searching for voids behind tunnel lining
- Solve other geotechnical problems related to the processing of seismoacoustic data
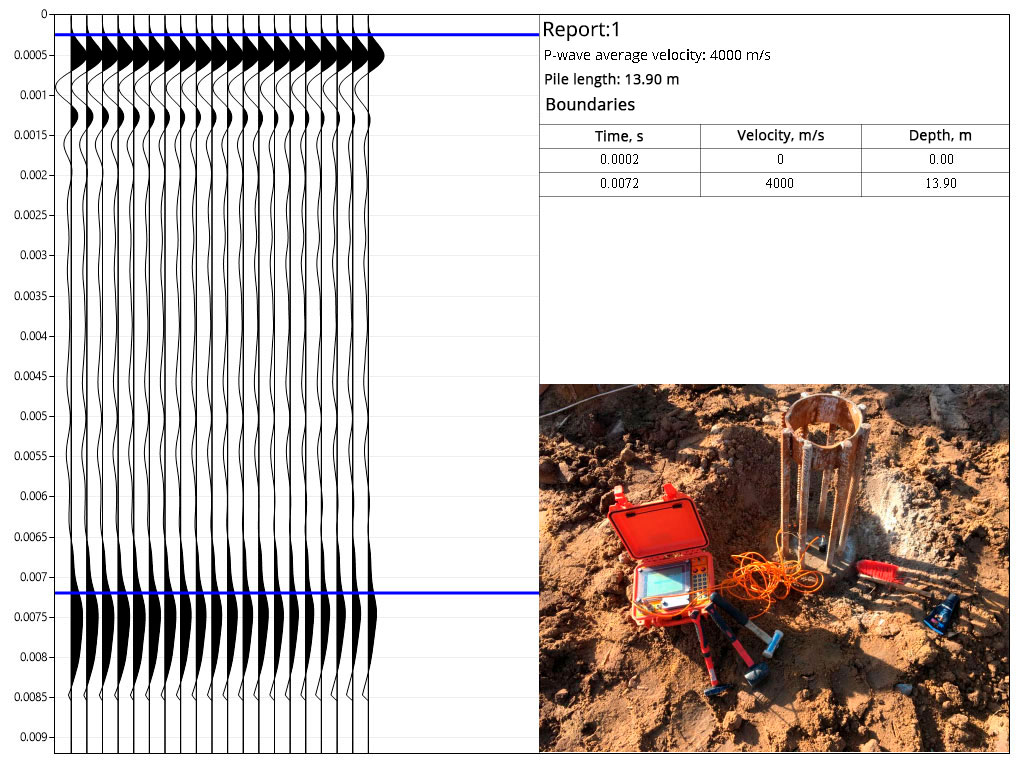
Impact method (Pile/Sonic Integrity Testing) is a method of nondestructive testing of foundation integrity through the propagation of acoustic waves. During testing, a shock wave is being excited and propagates through the concrete structure. Then, the recorder receives a signal of the medium’s response.
There are several options for further processing:
- Data processing in time domain (Pulse-Echo or Sonic-Echo Method)
- Data processing in frequency domain (The Transient Response or Impulse Response)
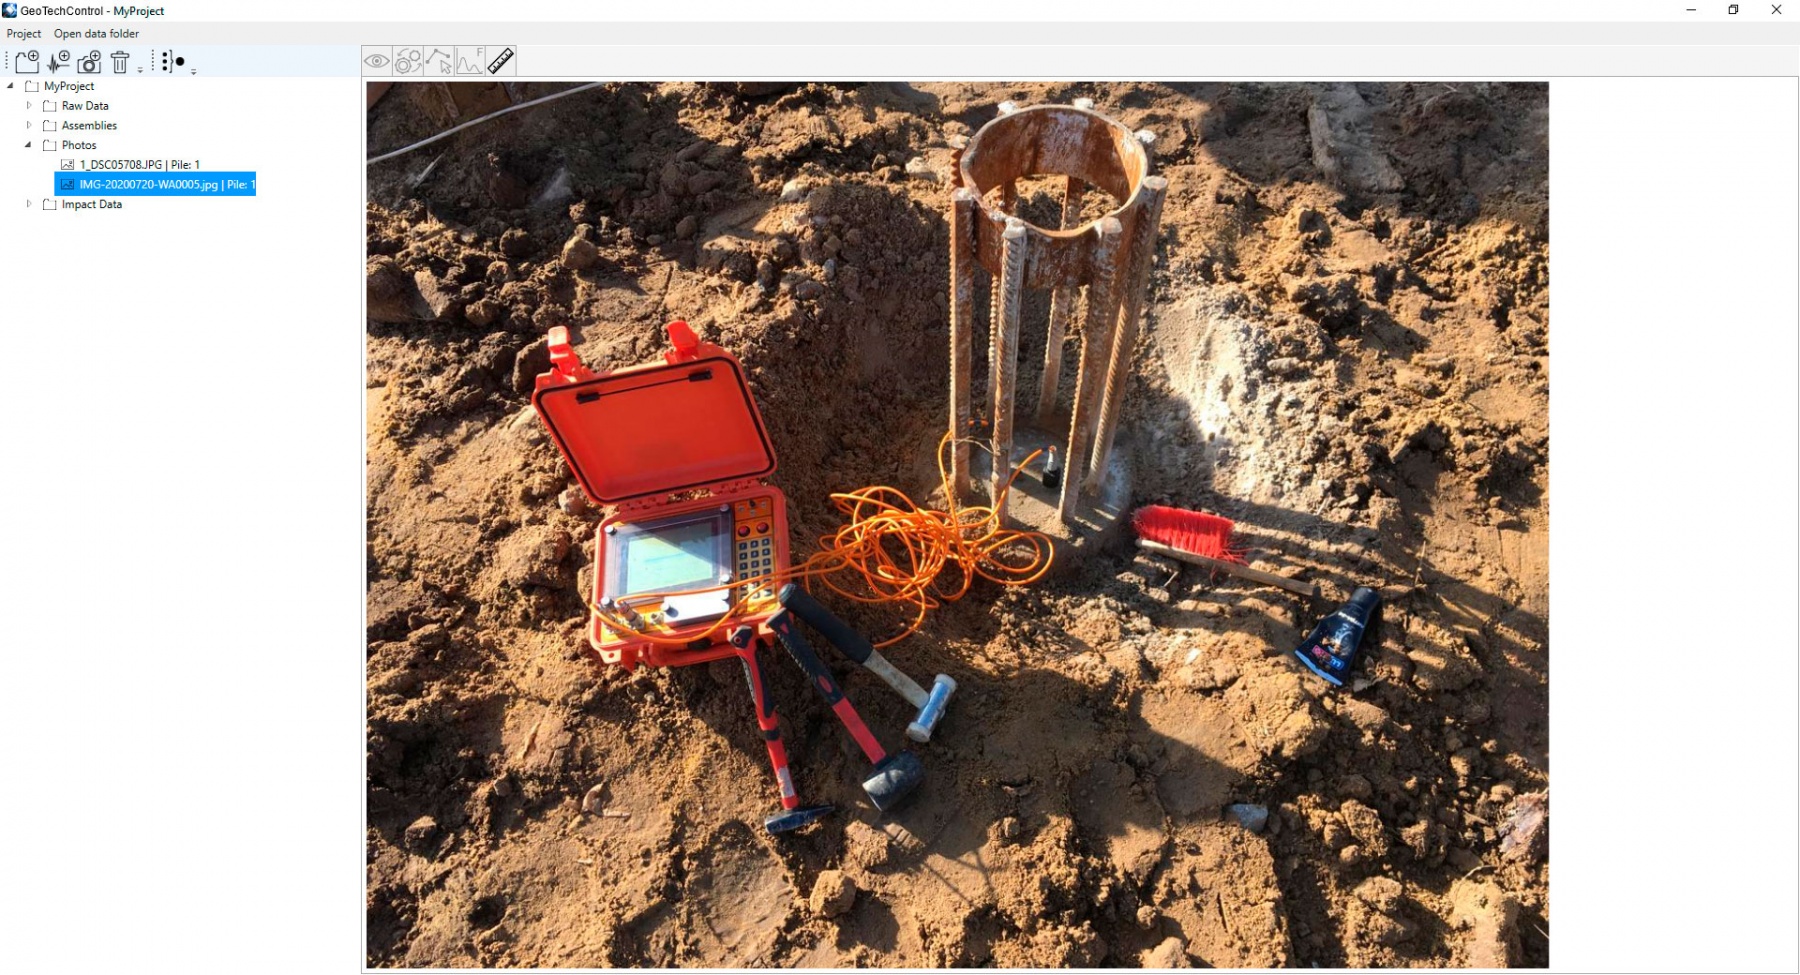
In GeoTechControl, a simple method of data input from any instruments recording data in SGY format (IDS-1, IDS-2, Sigma-4, etc.) and linking of photographic test information is implemented. Automatic and manual assembly of seismic gathers for further processing is realized by the following procedures:
- DC removal
- Automatic and manual static correction
- Trace rejection
- Amplitude correction
- 2D spatial filtering
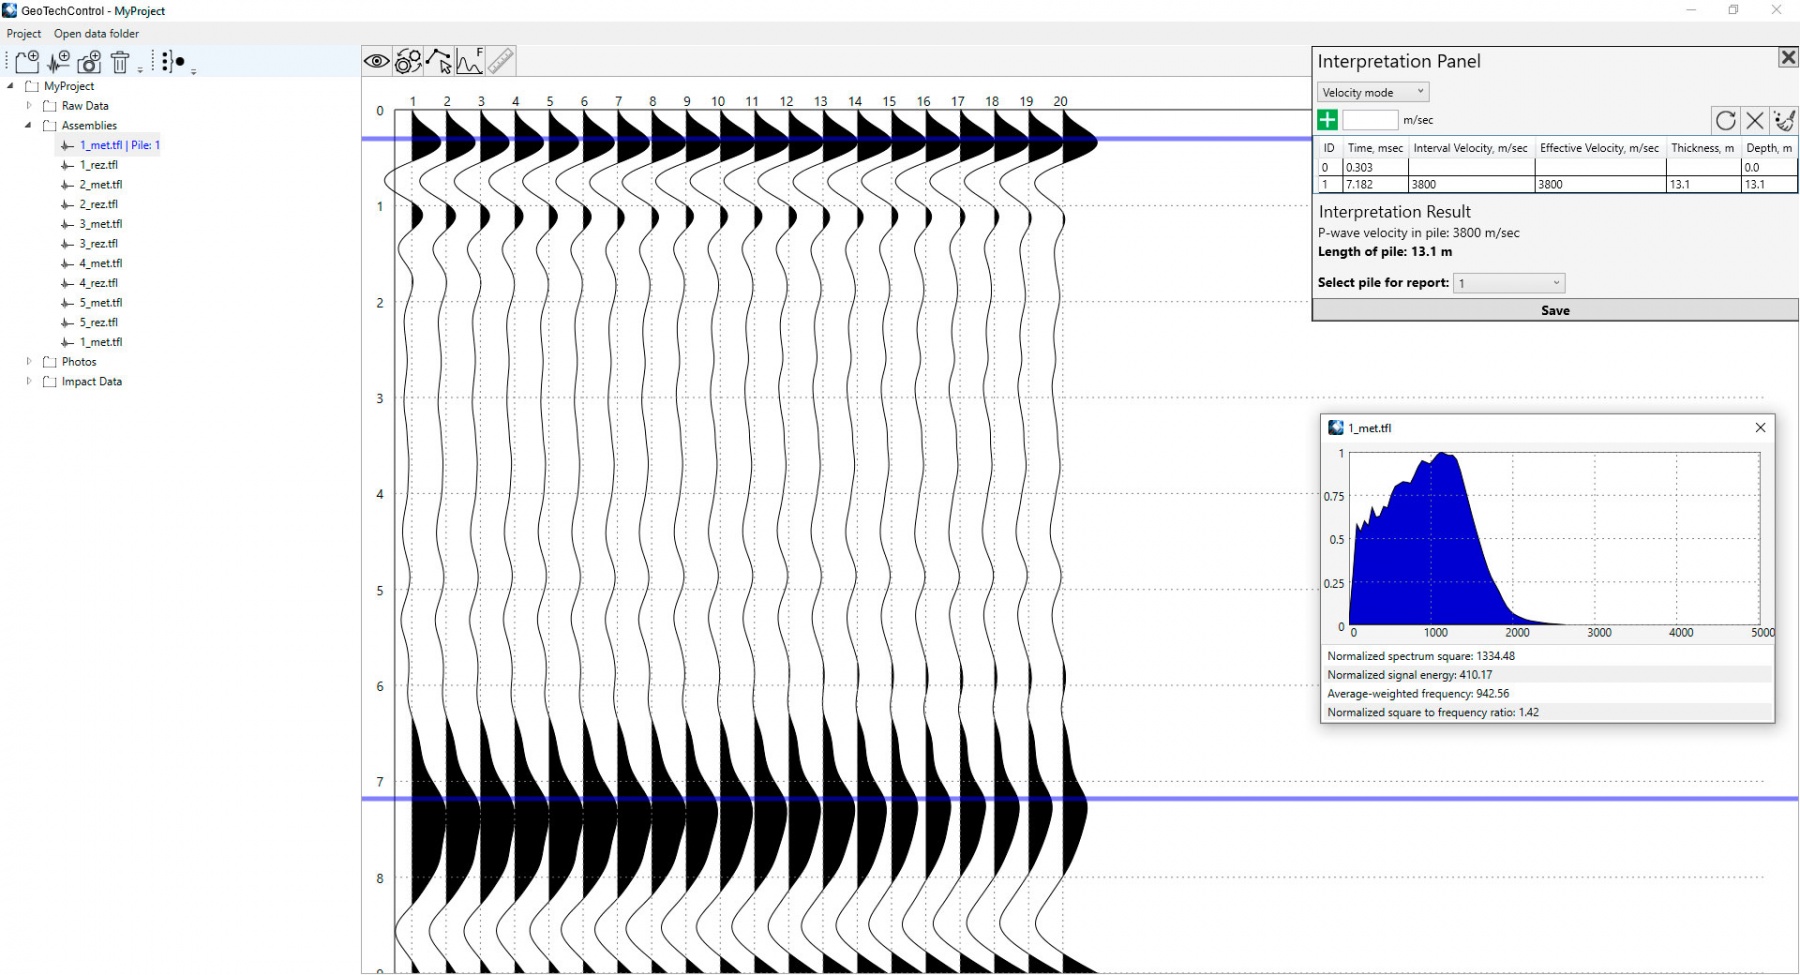
- Attribute analysis (building the attributes map for impact method)
- First break picking
At the stage of interpretation of the processed data the program implements two calculation algorithms:
- Calculation of pile depth by interval seismic wave velocity
- Calculation of seismic wave velocity by the depth of the pile boundary
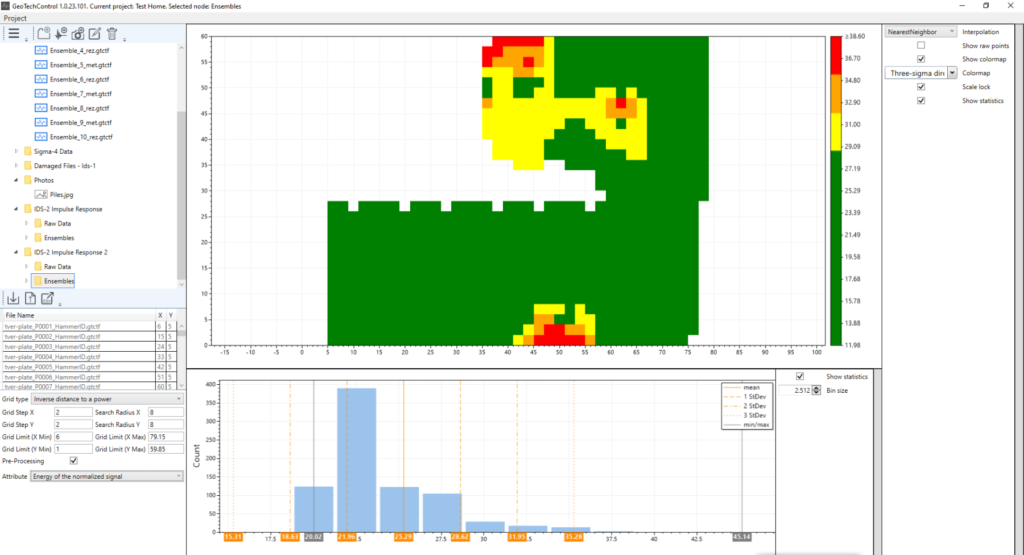
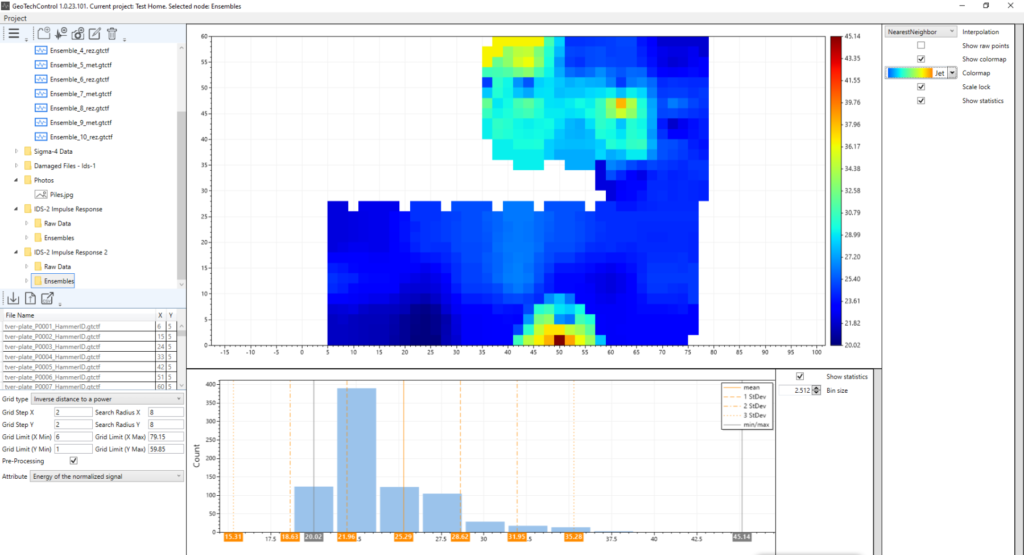
GeoTechControl implements a tool to process areal data and build attribute maps when working by the impact method on flat surfaces of foundations, tunnels and other building structures.
Analysis includes the calculation of following attributes:
- Normalized spectrum square
- Normalized signal energy
- Average-weighted frequency
- Normalized spectrum square to frequency ratio
At the end of all data processing and interpretation procedures, the program allows you to quickly generate a graphical report.
Processing graph for materials obtained by IDS-1
1. Data import
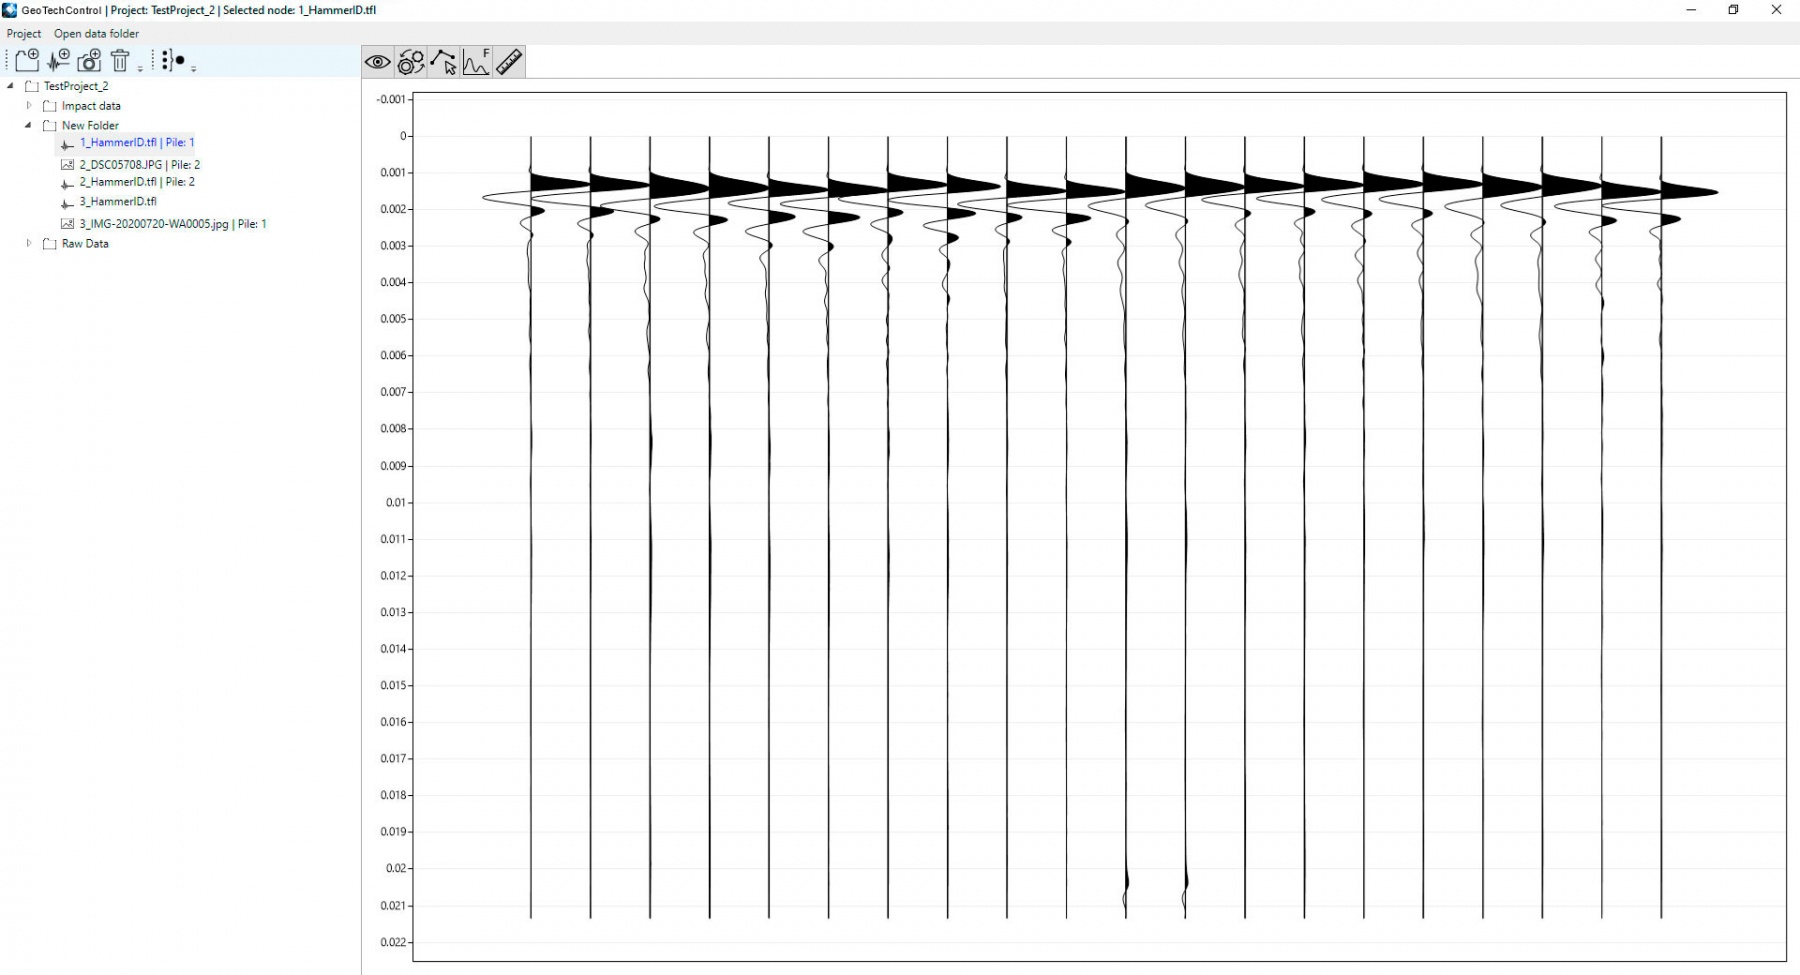
2. Preprocessing, rejection of noisy traces
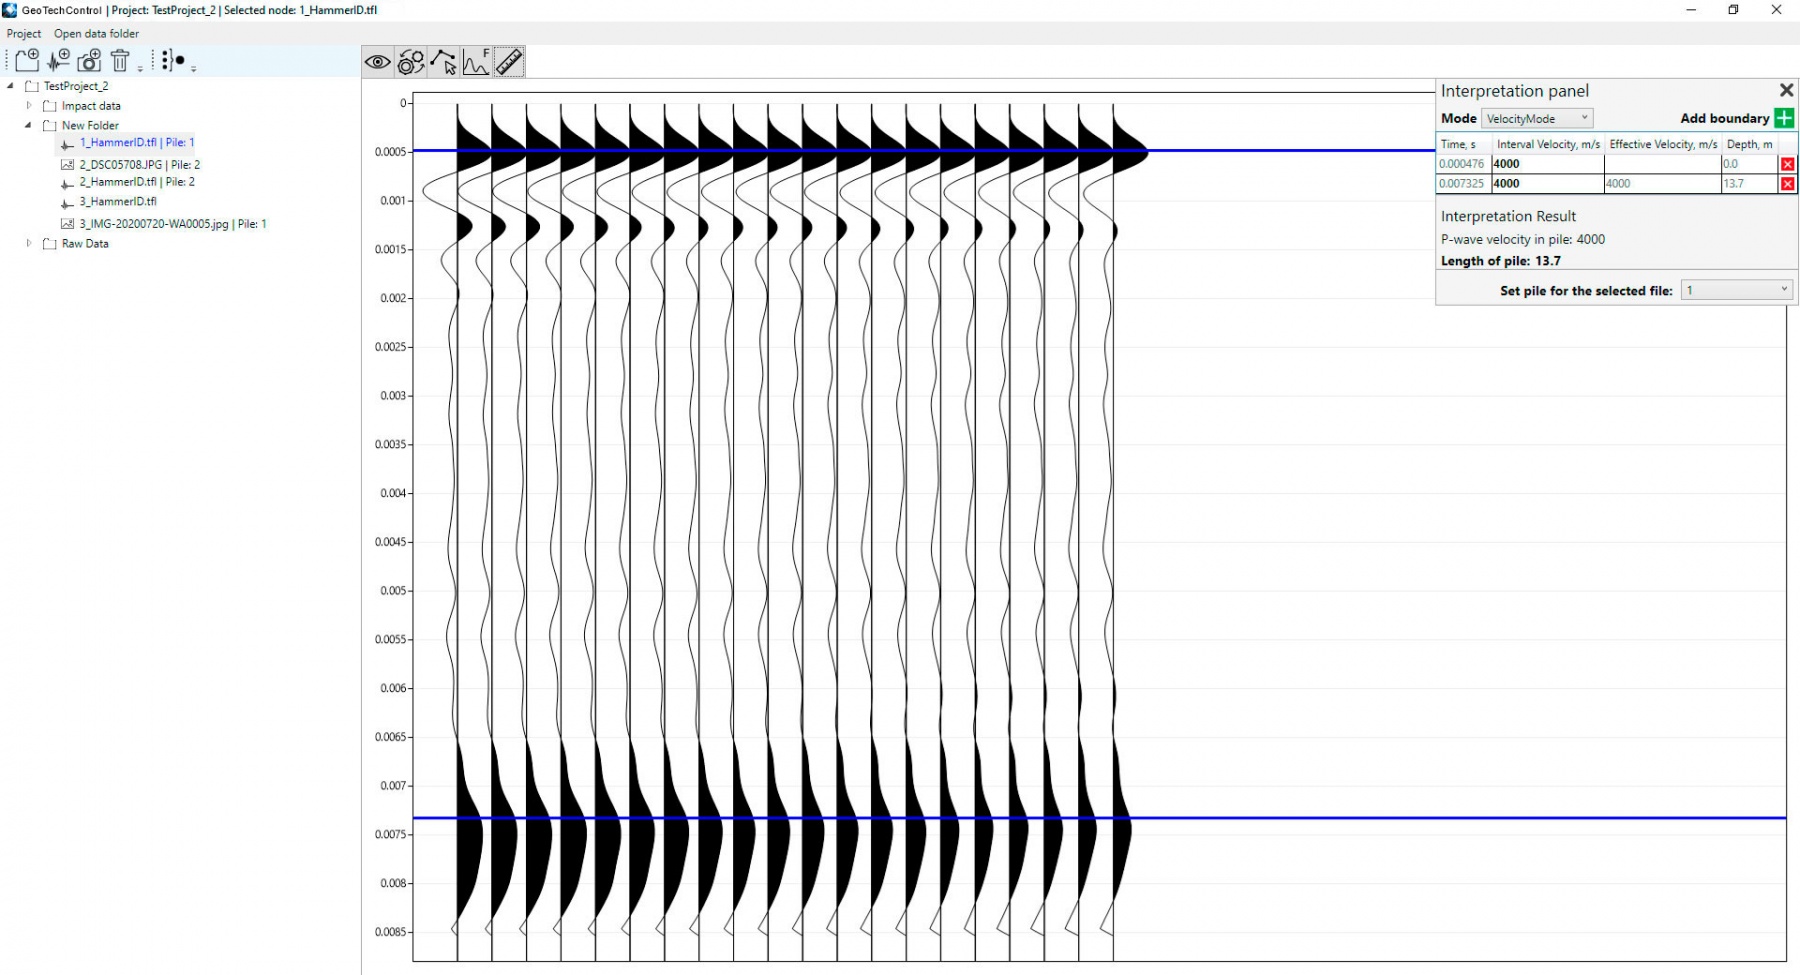
3. Obtaining the final trace, placing markers and calculating the length of piles
4. Uploading photos of the pile survey
5. Preparing a graphical report
ZondGM2d — New product for 2D gravity and magnetic interpretation
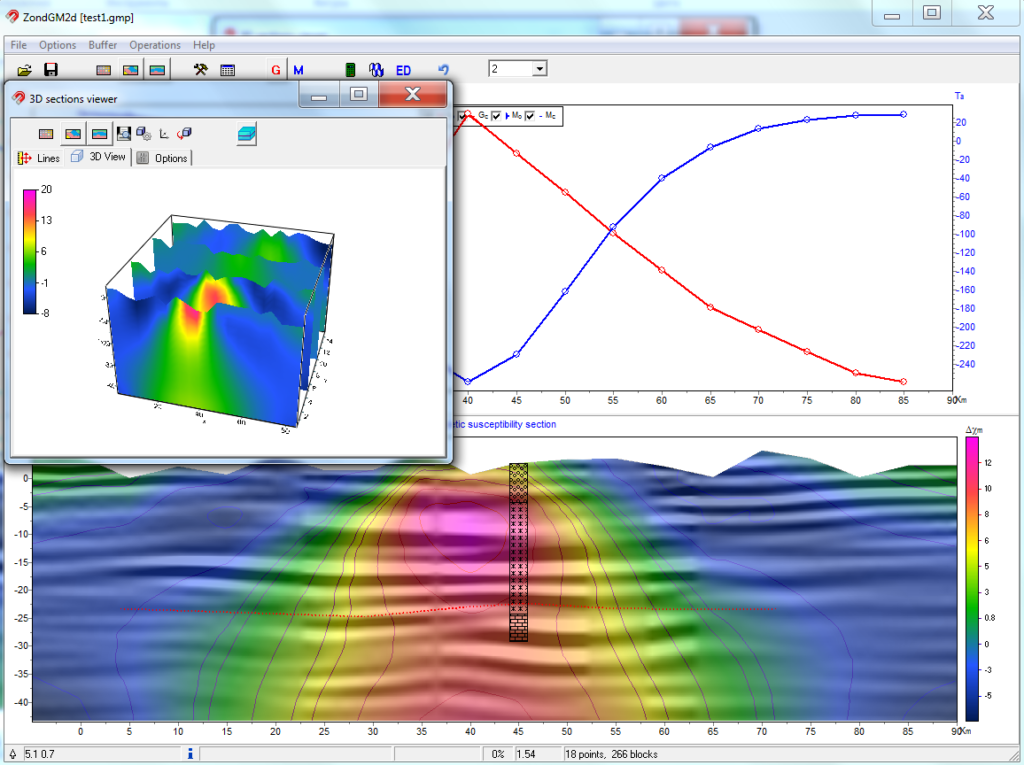
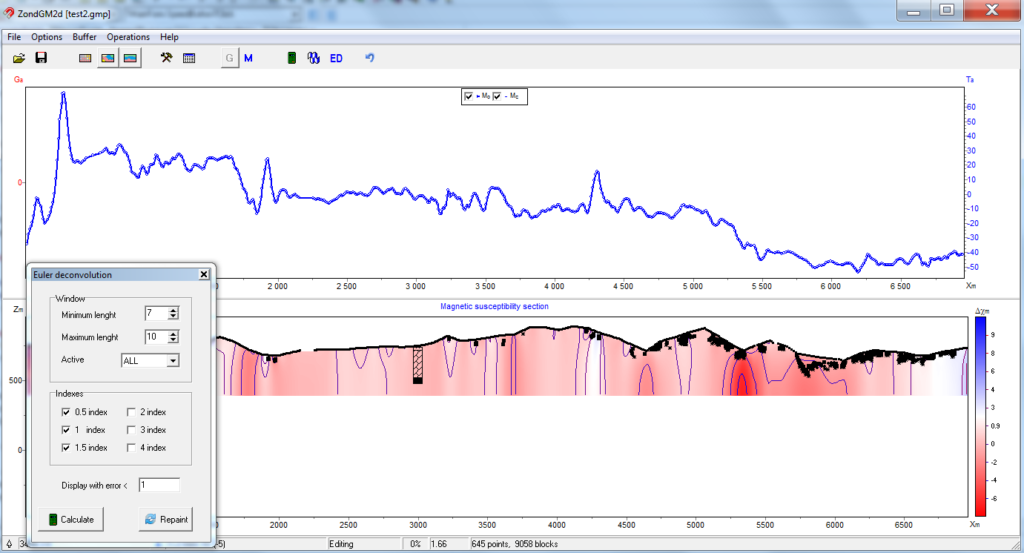
ZondGM2D new software for 2D gravity and magnetic survey combines the features of two predecessors ZondMag2D and ZondPGM. The program is designed for two-dimensional multiprofile interpretation of gravity and magnetic land / boreholes / aero data.
ZondGM2D is a ready solution for the interpretation of gravity and magnetic survey data, and presents a wide spectrum of tools from mathematical modeling to the interpretation of field data. User-friendly interface and wide possibilities of visualization is the key for effective solving of geological tasks.
Unlike predecessors, ZondGM2D offers three types of models:
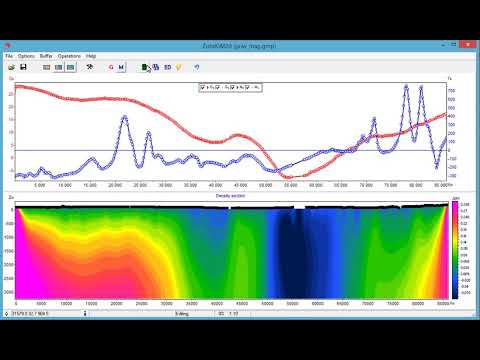
- Model is split by regular mesh of cellsThis type is most useful for solving the inverse problem (automatic density or magnetic susceptibility recovery). Inversion results is a good start choise for further geological and geophysical interpretation. A number of inversion algorithms are realized in software, most important are smooth and focused inversion — to get a smooth or piecewise smooth distribution of geophysical parameters.
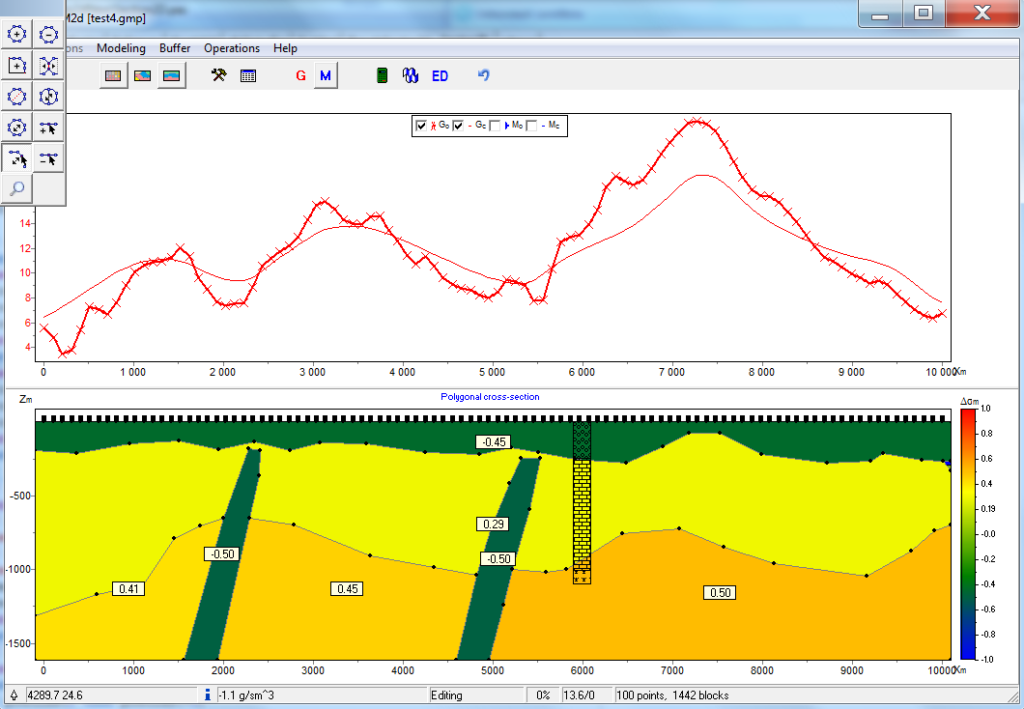
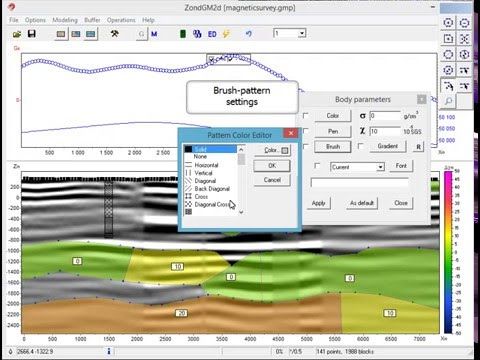
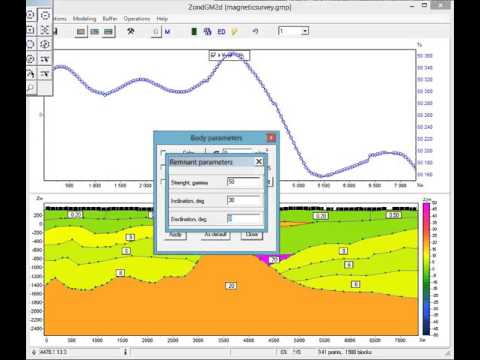
- Model is presented as set of polygonal bodiesPolygonal variant of gravimagnetic section construction that gives more structural approach to data interpretation. At this scheme two-dimensional section cosist of series of bodies with arbitrary geometries and specified density and magnetic susceptibility. Due to convenient and intuitively clear interface ZondGM2D allows to quickly creating any level of complexity models. The solution of the inverse problem for polygonal version of model presents automatic recovering petrophysical parametersand bodies geometry. Joint inversion of gravity and magnetic survey data is able for this case.
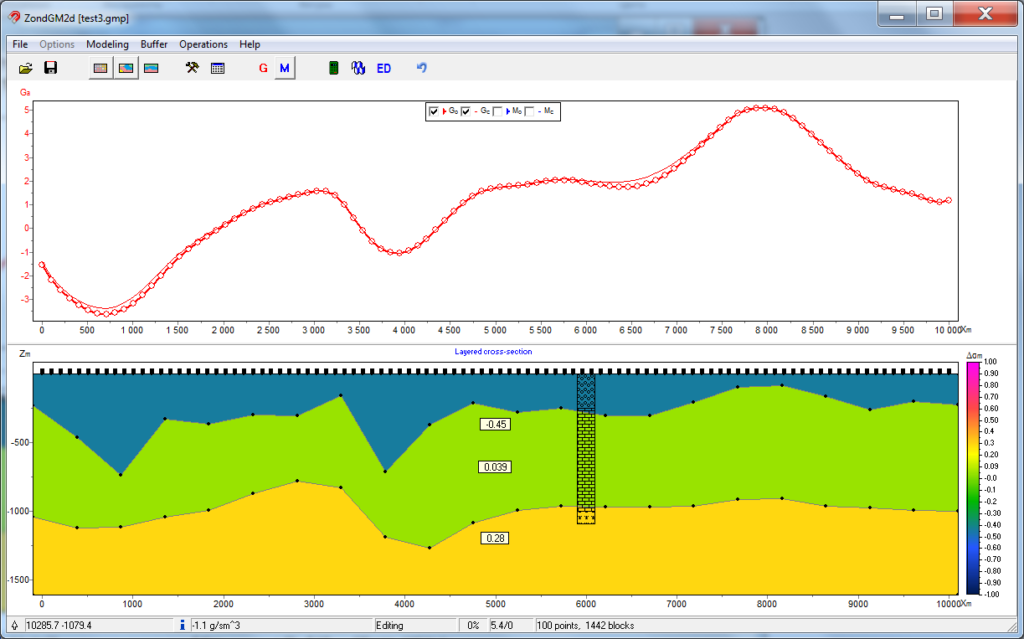
- Arbitrary layered modelThis type of model is useful for regions with layered geology. ZondGM2D solves forward and inverse problem for density and magnetic susceptibility, as well as for geometry of the boundary layers. Joint inversion of gravity and magnetic survey data is able for this case.
Calculations are made taking into account geomagnetic parameters of the study area, such as the declination and inclination of the magnetic induction vector, the value of the normal field, the magnetic susceptibility of the host rocks, the topography.
In addition to these algorithms, ZondGM2D presents classic version of the Euler deconvolution, which allows to get distribution of the simplest types of gravitational and magnetic sources. Sowtware works with any components of gravity and magnetic fields and do transormations.
Next transformations are able in ZondGM2D:
- Calculation of the vertical and horizontal derivatives
- Reduction of the magnetic field to pole
- Upwarding and suppression effect of topography
- Robust downwarding
Removing of background component is realized in two ways — by using the median in window or in substrating air upwarding field. Special algorithm of selective wavelet filtering for data denoising is used in software.
ZondGM2D works with simple text files, also supported well-known formats, or arbitrary columns test file. The interpretation results can be exported to different graphics format such as Surfer or Autocad, also text files and Excel worksheet.
While software was designed special consideration given to a priori data accounting. Because of equivalence of inverse geophysical problems, quality of the obtained results strongly depends on the amount of a priori data used. In ZondGM2D there is possibility of weights setting for measurements, fixing and limits making of changing features of different cells, using of a priori model as reference in inversion. There is also possibility to import and display results of measurements by other methods and cross-boreholes data that improved quality of results.
Fast 2D transformation of gravity and magnetic fields (29.08.2017)
Polygonal modeling in Zond software products (10.05.2016)
Remanent magnetization parameters in ZondGM2D (9.05.2016)
Fast transformation of potential fields to section (5.11.2015)
Joint inversion of seismic and gravity data (11.11.2014)
Reduce to pole in ZondGM2d (19.09.2014)
ZondGM3d — 3D gravity and magnetic
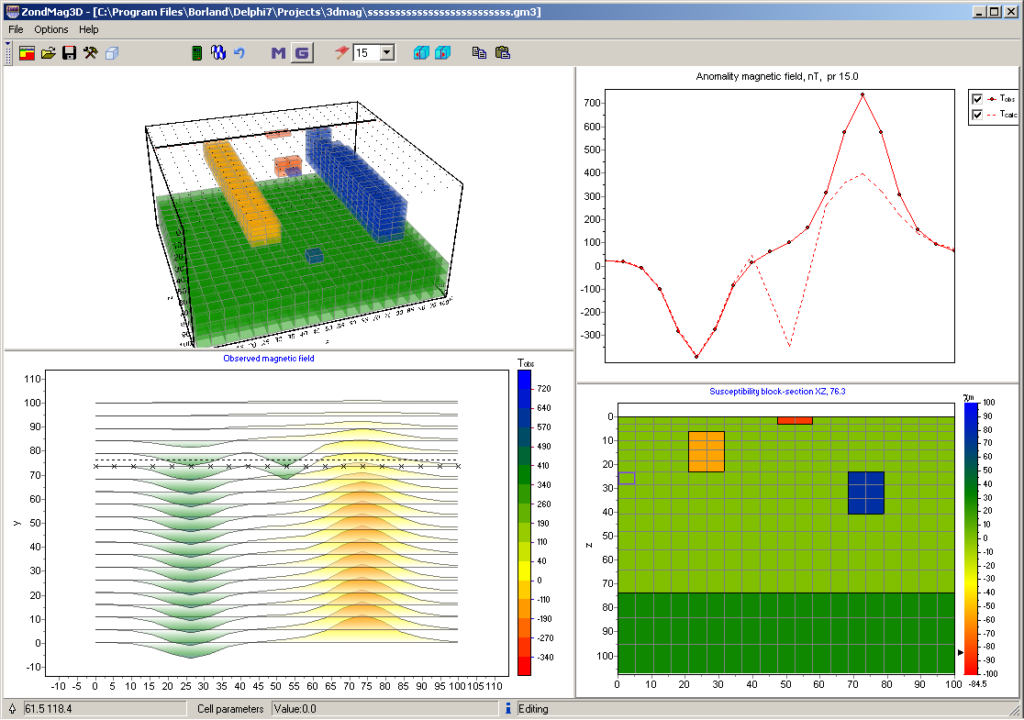
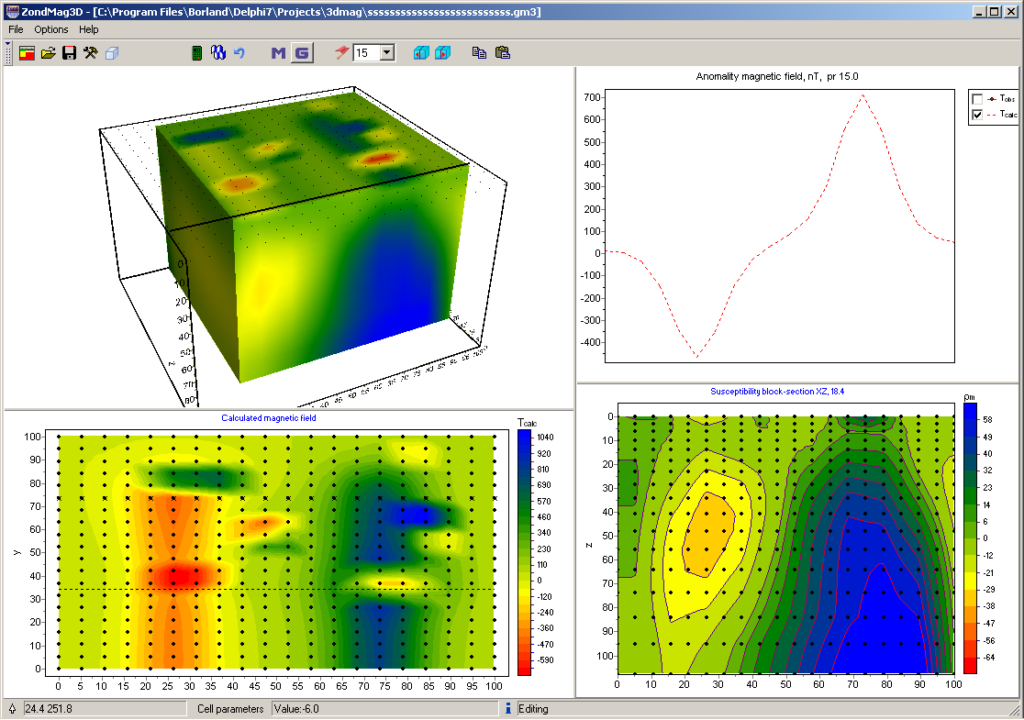
ZondGM3d program is desined for three-dimensional interpretation of gravity and magnetic data by (land and aero variants).
Anomalies of gravity caused of different dense heterogeneity are investigated in gravity survey. Influence of host rocks and surrounding topography is excluded by subtraction of the normal field and reductions. Magnetic survey is studied field generated by rocks that contain ferromagnetic minerals. Connection of measured on the surface field with magnetic properties of rocks allows to conclude about existence of magnetic objects.
ZondGM3d represents ready solution for gravity and magnetic methods, and solves wide range of problems from mathematical modeling to field data processing and interpretation. Convenient interface and variety of data visualization features allow to solve wide range of geological problems with maximum effectiveness.
ZondGM3d uses simple and clear data format which allows easily combining various systems of observation, including different variants of the topography setting up and other additional information.
Special graphics mode that allows to visualize data in the freandly form is presented.
Some variants of three-dimensional model display in the form of various sections and isosurfaces are realized in the program.
Important stage which prevents field measurement is mathematical modeling of petrophysical structure of work site. Modeling gives a chance to make a choice of optimum parameters of the observation system for decision of formulated geological problem.
As the general task of the program is inversion of density and magnetic susceptibility, some variants of inverse problem decision are realized in ZondGM3d, basic of them are: smoothing inversion — to get smooth model and focusing — to get piece-smoothed model of petrophysical parameters with depth.
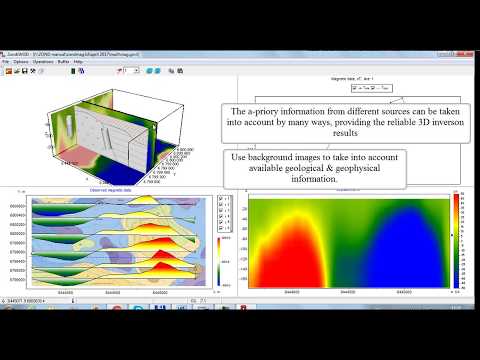
While program was designed special consideration given to a priori data accounting. Because of equivalence of inverse geophysical problems, quality of the obtained results strongly depends on the amount of a priori data used. In ZondGM3d there is possibility of weights setting for measurements, fixing and limits making of changing features of different cells, using of a priori model as reference in inversion. There is also possibility to import and display results of measurements by other methods and cross-boreholes data that improved quality of results.
Results of 3D magnetic drone survey inversion (18.12.2020)
ZondGM3D software for 3D gravity and magnetic inversion (29.06.2017)
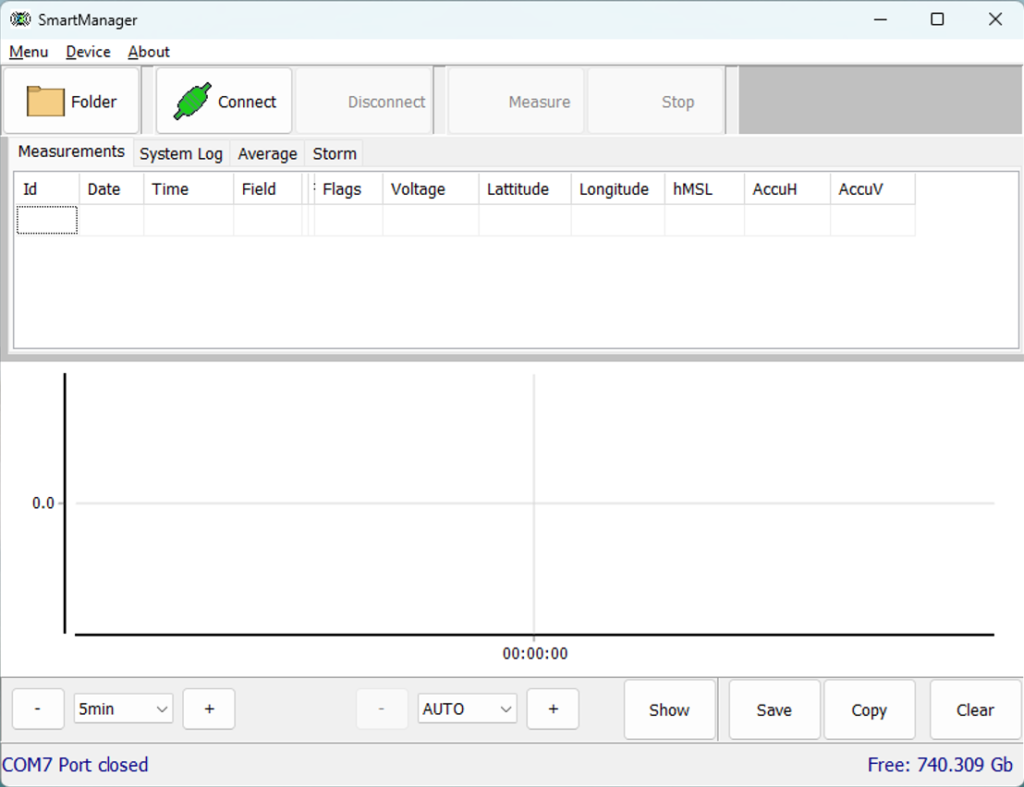
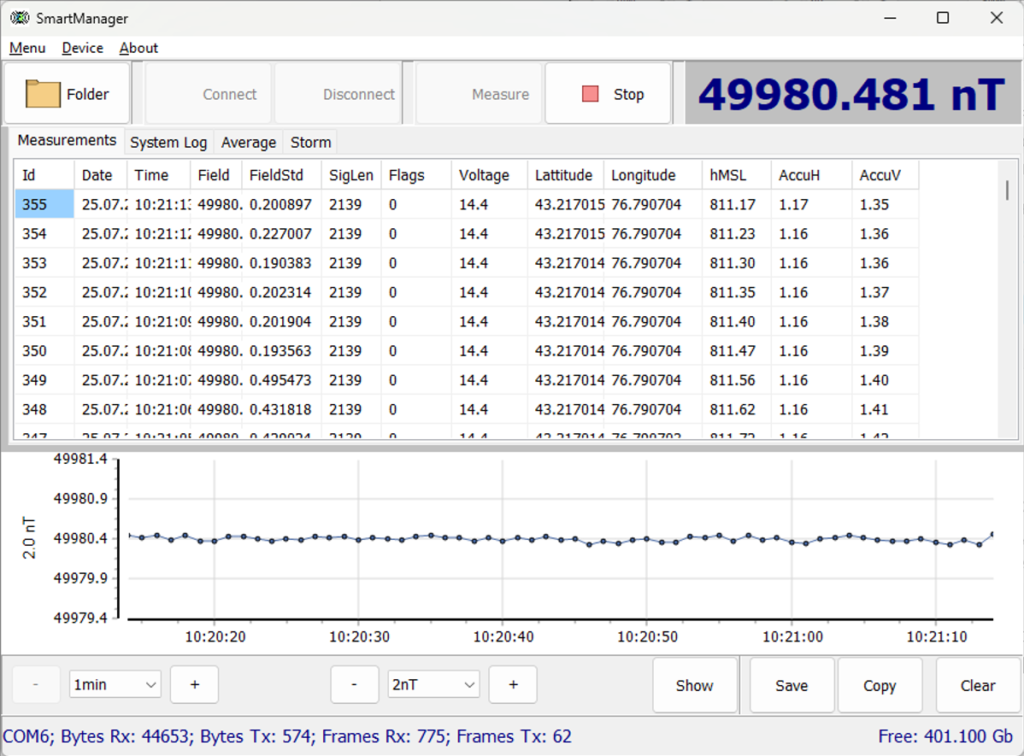
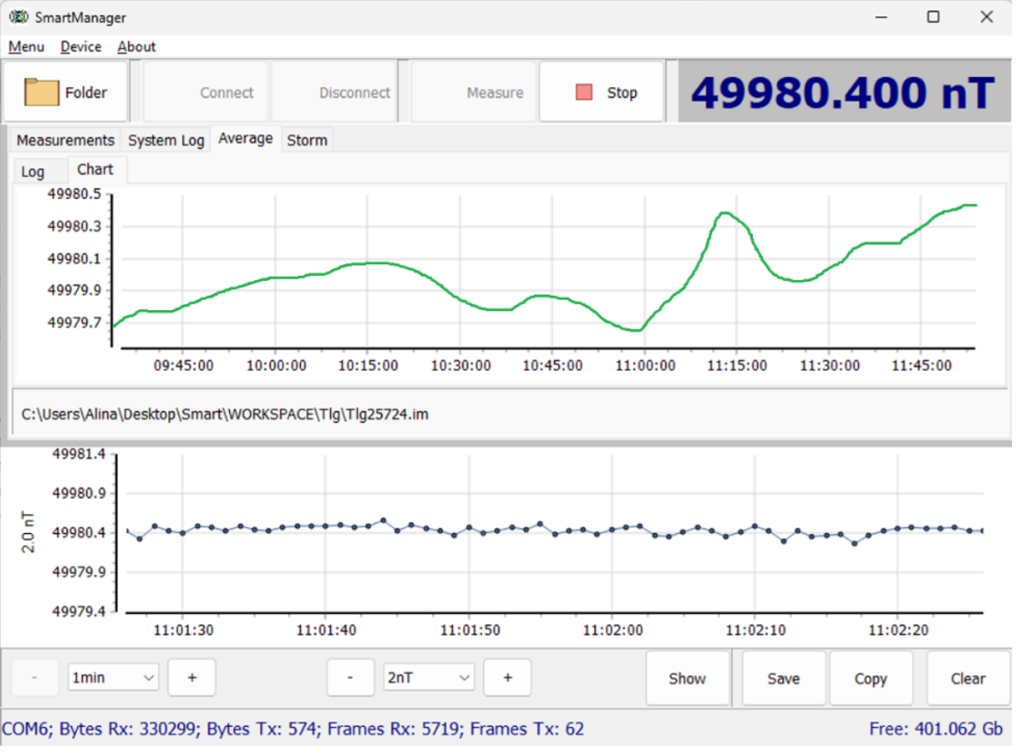
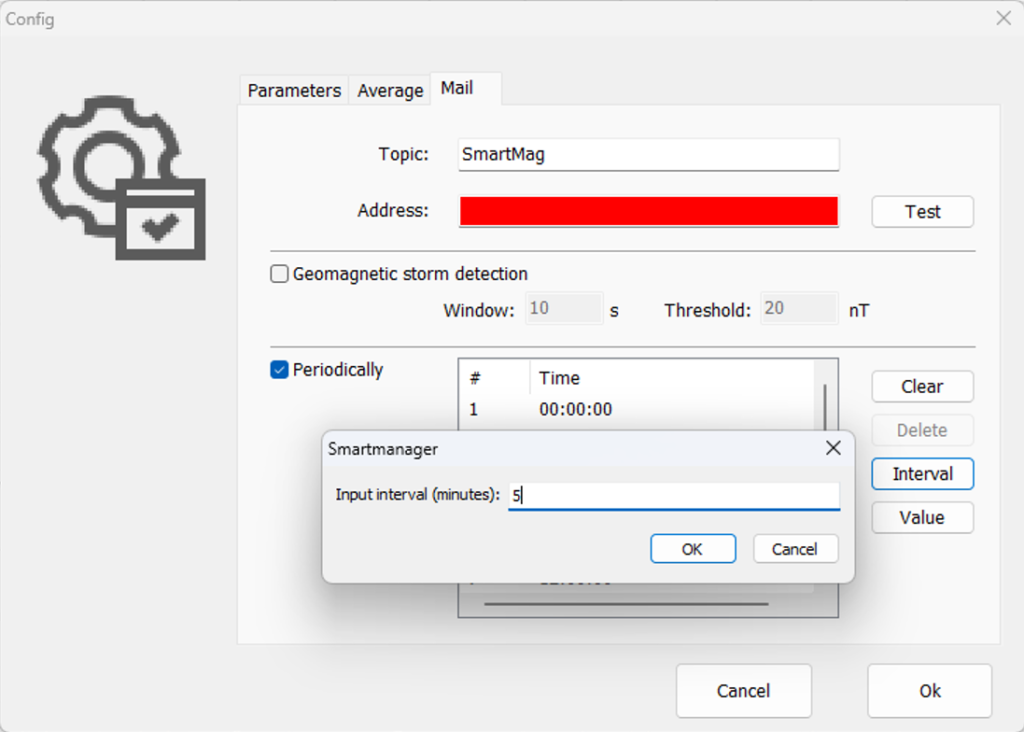
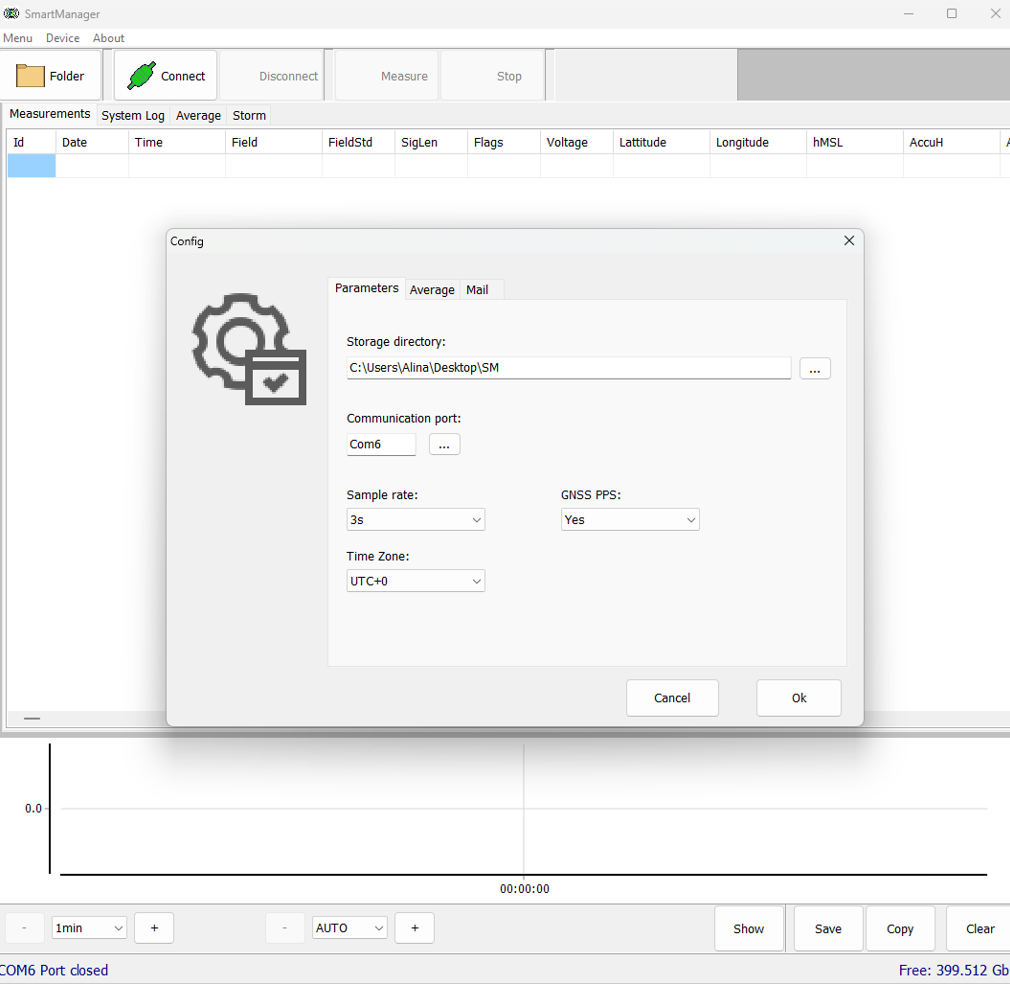
SmartManager software for remote operations with GEODEVICE magnetometers
Equipment & Software for Geophysical Surveys: Design, Manufacture, Support, Supply
GEODEVICE is a group of specialized companies that develops, manufactures, and supplies
advanced geophysical equipment and software for a wide range of applications, from land-
based surveys to marine and borehole explorations.
The key areas of GEODEVICE developments are high and ultra-high resolution marine seismic,
borehole seismic, land, drone and marine magnetic.
The focus is on a broad range of industries and scientific fields, providing tailored solutions for:
- Geotechnical Monitoring
- Engineering Surveys
- Environmental Surveys
- Archaeological Surveys
- Geophysical Support for Geological Exploration
Let’s Connect
Need assistance? Get in touch with our team.